$0.00
In stock
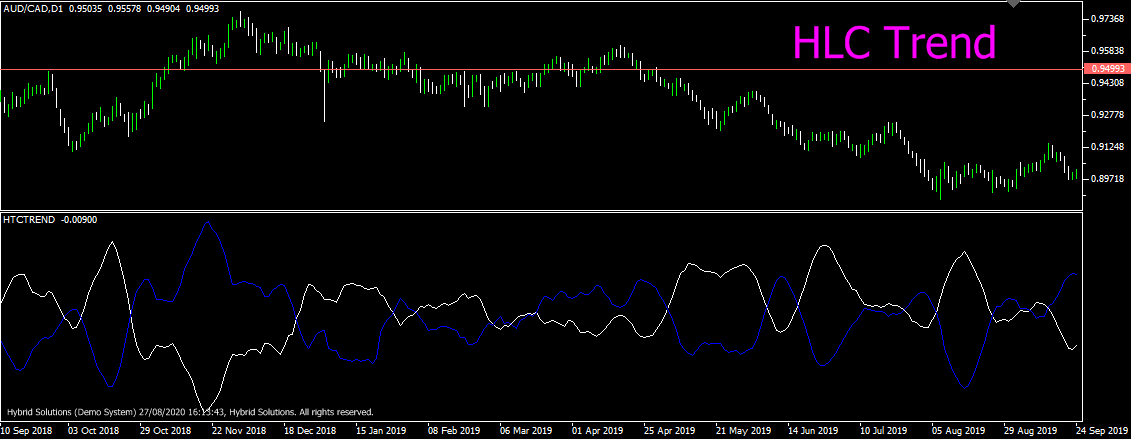
HLC Trend is a price-following indicator that identifies market trends and volatility. It plots 2 main lines, up bias line and down bias line along with a separate neutral line which is always set at zero for reference.
(Downloads - 908)

HLC Trend is a price-following indicator that identifies market trends and volatility. It plots 2 main lines, up bias line and down bias line along with a separate neutral line which is always set at zero for reference. The up bias line is calculated from the difference between the average close price and average high price. The down bias line is calculated from the difference between the average low price and the average close price. Here, the average close price is more sensitive for the shortest average period whereas the average high price is less sensitive for the longest average period.
The gap between the up bias line and a down bias line represents market volatility. The wider gap means the market has higher volatility. Moreover, if both lines are close together and are nearly or equal to zero indicate that the market is running on the sideway.
The Indicator also represents the Volatility Strength of the market with Over Bought & Over Sold situations. The line’s slope represents the market momentum strength. A higher slope indicates higher volatility whereas, a flat line after a high slope indicates that the market is about to reverse. For example, when up bias is greater than zero and stays flat after a high slope, it is an indication of an overbought situation.
The market will have a strong uptrend when up bias is greater than zero and down bias is less than zero. HCL Indicator generates a buy signal when up bias is greater than zero and cross above down bias line. Similarly, the Market will have a strong downtrend when the up bias is less than zero, and the downward bias is greater than zero. The more both lines are away from zero represents the stronger trend. The indicator generates a sell signal when the up bias is lower than zero and cross below down bias line.
Configurable Inputs
1.Close Period:- number of moving average periods applied to close price.
2.Low Period:- number of moving average periods applied to low price.
3.High Period:- number of moving average periods applied to high price.
Usage
- Download the attachment from vStore or directly from the vStore tab in your terminal by performing a right-click on it and selecting Download & Install
- Copy it to your company VertexFX Local VTL Files folder i.e.C:Users”Username”AppDataRoamingVertexFX Client Terminals“Company name”VTL11Local VTL Scripts
- Restart your Client Terminal or Right Click on “Local VTL Scripts” Tree Node to find the script.
Hindi Version:
एचएलसी ट्रेंड, वेरटेक्सएफएक्स ट्रेडिंग प्लेटफॉर्म के लिए एक मूल्य-निम्नलिखित संकेतक है जो बाजार की प्रवृत्ति और अस्थिरता की पहचान करता है। यह 2 मुख्य लाइनों, अप पूर्वाग्रह रेखा और नीचे पूर्वाग्रह रेखा के साथ-साथ एक अलग तटस्थ रेखा है जो हमेशा संदर्भ के लिए शून्य पर सेट है। अप बायस लाइन की गणना औसत समापन मूल्य और औसत उच्च मूल्य के बीच के अंतर से की जाती है। डाउन बायस लाइन की गणना औसत न्यूनतम मूल्य और औसत समापन मूल्य के बीच के अंतर से की जाती है। यहां, औसत नज़दीकी कीमत सबसे कम औसत अवधि के लिए अधिक संवेदनशील है, जबकि औसत उच्च कीमत सबसे लंबी औसत अवधि के लिए कम संवेदनशील है।
पूर्वाग्रह रेखा और नीचे पूर्वाग्रह रेखा के बीच का अंतर बाजार की अस्थिरता का प्रतिनिधित्व करता है। व्यापक अंतर का मतलब है कि बाजार में उच्च अस्थिरता है। इसके अलावा, अगर दोनों लाइनें एक साथ पास हैं और शून्य के बराबर या बराबर हैं, तो संकेत मिलता है कि बाजार साइड-वे पर चल रहा है। संकेतक ओवर बॉट एंड ओवर सोल्ड स्थितियों के साथ बाजार की अस्थिरता शक्ति का भी प्रतिनिधित्व करता है। लाइन की ढलान बाजार की गति का प्रतिनिधित्व करती है। उच्च ढलान उच्च अस्थिरता का संकेत देता है, जबकि उच्च ढलान के बाद एक सपाट रेखा इंगित करती है कि बाजार उलट होने वाला है।
उदाहरण के लिए जब अप पूर्वाग्रह शून्य से अधिक है और उच्च ढलान के बाद सपाट रहता है, तो यह अधिक खरीदी गई स्थिति का संकेत है।
जब बाजार पूर्वाग्रह शून्य से अधिक और नीचे पूर्वाग्रह शून्य से कम हो तो बाजार में तेजी का रुख रहेगा। एचसीएल संकेतक खरीद संकेत देता है जब अप पूर्वाग्रह शून्य से अधिक होता है और नीचे पूर्वाग्रह रेखा से ऊपर होता है। इसी तरह, बाजार में नीचे की ओर मजबूत रुझान होगा जब अप पूर्वाग्रह शून्य से कम है और नीचे पूर्वाग्रह शून्य से अधिक है। यदि दोनों रेखाएं शून्य से दूर हैं तो मजबूत बाजार प्रवृत्ति का प्रतिनिधित्व करती है। इंडिकेटर सेल सिग्नल तब उत्पन्न करता है जब अप पूर्वाग्रह शून्य से कम और डाउन बायस लाइन से नीचे होता है।
प्रयोग:
विस्टोर से अटैचमेंट डाउनलोड करें या सीधे अपने टर्मिनल में विस्टोर टैब से इसे राइट क्लिक करके डाउनलोड करें और इंस्टॉल करें चुनें।
इसे अपनी कंपनी VertexFX स्थानीय वीटीएल फ़ाइलें फ़ोल्डर में कॉपी करें, अर्थात C:Users”Username”AppDataRoamingVertexFX Client Terminals”Company name”VTL11Local VTL Scripts
अपने क्लाइंट टर्मिनल को पुनः आरंभ करें या स्क्रिप्ट खोजने के लिए “स्थानीय वीटीएल लिपियों” ट्री नोड पर राइट क्लिक करें।
Additional information
| Plugin-Type | Client VTL – Custom Indicator |
|---|---|
| Compatibility |

