
CCI MTF Coloured

$0.00
CCI MTF Colored VTL scriptis a VertexFX indicator that identifies the price sentiment using a variation of the Commodity Channel Index (CCI) indicator.
(Downloads - 556)
 CCI MTF Colored VTL scriptis a VertexFX indicator that identifies the price sentiment using a variation of the Commodity Channel Index (CCI) indicator.
As the name suggests, the CCI MTF Colored indicator is based on the Commodity Channel Index (CCI), originally developed by Donald Lambert. It provides a color representation of the CCI indicator along with multi time-frame support, thereby providing a holistic view of the CCI indicator. The CCI is calculated as:
CCI = (Typical Price – Simple Moving Average) / (0.015 x Mean Deviation)
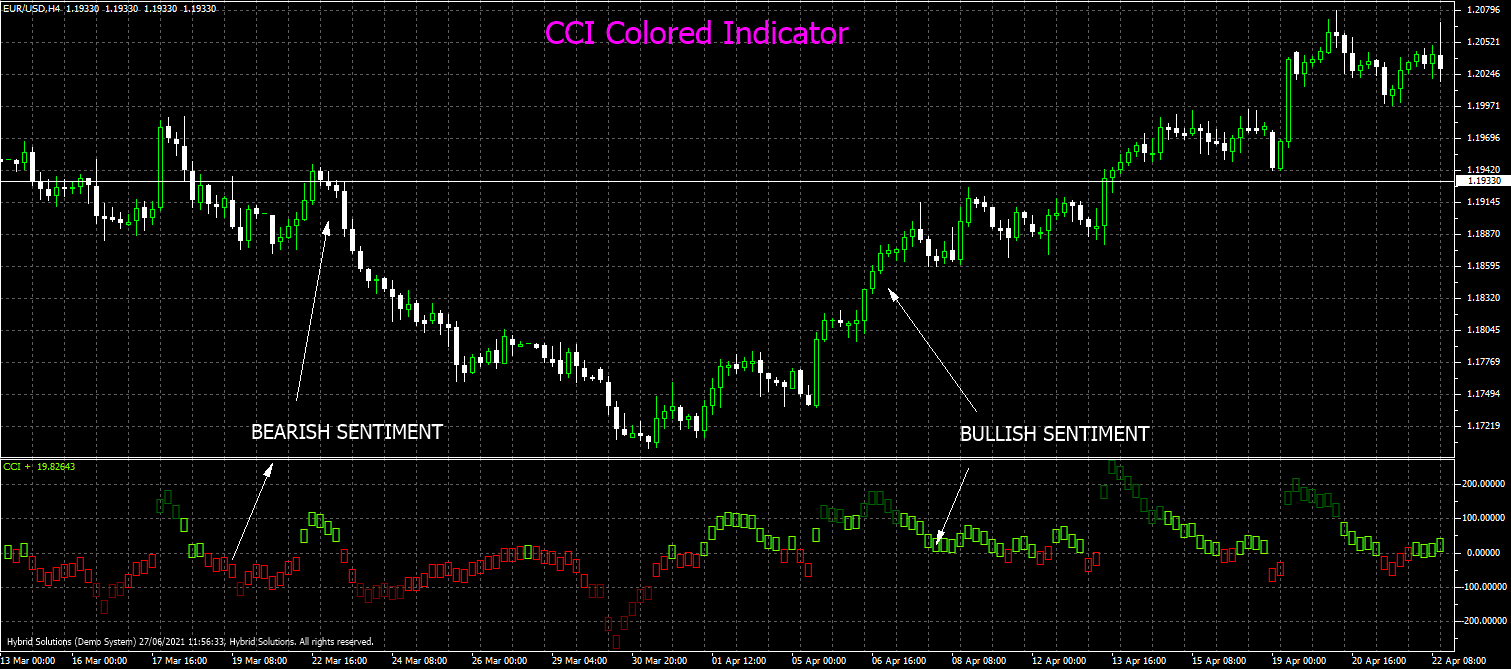
When the value of CCI is above +100, it implies a strong bullish trend, whereas a CCI reading below -100 implies strong bearish trends. Similarly, readings from 0 to +100 imply mildly bullish to moderately bullish, and readings between 0 and -100 imply mildly bearish to moderately bearish trends.
When CCI is above +100, it is displayed in dark green, between 0 and +100 in light green, between 0 and -100 in light red, and below -100 in dark red. The indicator also allows the user to specify the time-frame of the price series to plot – the user can plot a lower time-frame trend on a higher timeframe. For example, the 15-minute indicator values can be plotted on a 1-hour chart.
There are eight phases of the CCI MTF Colored indicator, explained below,
a) Light green and rising – The bullish trend is gathering strength and likely to continue and increase its strength.
b) Dark green and rising – The bullish trend is very strong and likely to continue. Watch other indicators for end of the strong bullish trend.
c) Dark green and falling – The strong bullish trend has ended, and the market is mildly bullish or consolidating.
d) Light green and falling – Exhaustion of the bullish trend. The market is turning sideways, or bearish.
e) Light red and falling – The bearish trend is becoming stronger and the price is likely to continue falling.
f) Dark red and falling – The bearish trend is very strong and likely to continue. Watch other indicators for end of the strong bearish trend.
g) Dark red and rising – The strong bearish trend has ended, and the market is in pullback or consolidation phase.
h) Light red and rising – Exhaustion of the bearish trend. The market is turning sideways or bullish.
On cyclical instruments and commodities, the CCI MTF Colored indicator moves from a, b, c, d, e, f, g, h – moving from neutral to mildly bullish, to strongly bullish, back to consolidation, then mildly bearish, to strongly bearish, and then back to consolidation (pullback).
It is recommended that the CCIMTF Colored indicator be used in conjunction with other trend following indicators like MACD or Stochastic Oscillator.
Configurable Inputs
1. PERIOD – The period used to calculate the CCI values.
2. PRICE_FIELD – The price field used to calculate the CCI values. The permissible values are, 0 (Close), 1 (Open), 2 (High), 3 (Low), 4 (Median), 5 (Typical) and 6 (Weighted).
Usage
- Download the attachment from vStore or directly from the vStore tab in your terminal by performing a right-click on it and selecting Download & Install
- Copy it to your company VertexFX Local VTL Files folder i.e.C:Users”Username”AppDataRoamingVertexFX Client Terminals“Company name”VTL11Local VTL Scripts
- Restart your Client Terminal or Right Click on “Local VTL Scripts” Tree Node to find the script.
Hindi Version:
सीसीआई एमटीएफ COLORED इंडिकेटर
CCI MTF Colored एक VertexFX क्लाइंट-साइड इंडिकेटर है जो कमोडिटी चैनल इंडेक्स (CCI) इंडिकेटर की विविधता का उपयोग करके मूल्य भावना की पहचान करता है। यह अनुशंसा की जाती है कि सीसीआई एमटीएफ colored संकेतक का उपयोग MACD या STOCHASTIC OSCILLATOR जैसे संकेतकों के बाद अन्य TREND के संयोजन के साथ किया जाए।
CCI MTF COLORED संकेतक कमोडिटी चैनल इंडेक्स (CCI) पर आधारित है, जिसे मूल रूप से डोनाल्ड लैम्बर्ट द्वारा विकसित किया गया था। यह मल्टी टाइम-फ्रेम सपोर्ट के साथ सीसीआई इंडिकेटर का कलर रिप्रेजेंटेशन प्रदान करता है, जिससे सीसीआई इंडिकेटर का समग्र दृष्टिकोण प्रदान होता है।
जब CCI का मूल्य +100 से ऊपर होता है, तो इसका मतलब एक मजबूत तेजी की प्रवृत्ति है, जबकि -100 से नीचे का CCI पढ़ने से मजबूत मंदी की प्रवृत्ति का पता चलता है। इसी तरह, 0 से +100 तक की रीडिंग का मतलब हल्का तेजी से मध्यम तेजी से है, और 0 और -100 के बीच की रीडिंग का मतलब हल्का मंदी से मध्यम मंदी की प्रवृत्ति है।
जब CCI +100 से ऊपर होता है, तो इसे DARK GREEN रंग में, 0 और +100 के बीच LIGHT GREEN रंग में, 0 से -100 के बीच LIGHT RED रंग में और -100 से नीचे DARK RED रंग में प्रदर्शित किया जाता है। संकेतक उपयोगकर्ता को प्लॉट करने के लिए मूल्य श्रृंखला की TIME FRAME निर्दिष्ट करने की भी अनुमति देता है – उपयोगकर्ता HIGHER TIME-FRAME पर LOWER TIME-FRAME की प्रवृत्ति को प्लॉट कर सकता है।
सीसीआई एमटीएफ COLORED संकेतक के आठ चरण हैं, जो आगे बताते हैं,
LIGHT GREEN और RISING – तेजी का रुझान ताकत हासिल कर रहा है और इसके जारी रहने और अपनी ताकत बढ़ाने की संभावना है।
DARK GREEN और RISING – तेजी का रुझान बहुत मजबूत है और इसके जारी रहने की संभावना है। मजबूत तेजी के रुझान के अंत के लिए अन्य संकेतक देखें।
DARK GREEN और FALLING – मजबूत तेजी की प्रवृत्ति समाप्त हो गई है, और बाजार हल्का तेज या समेकित है।
LIGHT GREEN और FALLING – तेजी की प्रवृत्ति का थकावट। बाजार बग़ल में या मंदी की ओर मुड़ रहा है।
LIGHT RED और FALLING – मंदी की प्रवृत्ति मजबूत होती जा रही है और कीमत में गिरावट जारी रहने की संभावना है।
DARK RED और FALLING – मंदी की प्रवृत्ति बहुत मजबूत है और इसके जारी रहने की संभावना है। मजबूत मंदी की प्रवृत्ति के अंत के लिए अन्य संकेतक देखें।
DARK RED और RISING – मजबूत मंदी की प्रवृत्ति समाप्त हो गई है, और बाजार पुलबैक या समेकन चरण में है।
LIGHT RED और RISING – मंदी की प्रवृत्ति की थकावट। बाजार बग़ल में या तेजी से बदल रहा है।
चक्रीय उपकरणों और वस्तुओं पर, CCI MTF COLORED संकेतक तटस्थ से हल्के से तेजी की ओर, जोरदार तेजी की ओर, वापस समेकन की ओर, फिर हल्के से मंदी की ओर, जोरदार मंदी की ओर, और फिर समेकन (पुलबैक) की ओर जाता है।
जब संकेतक DARK RED और गिर रहा है, तो EURUSD की कीमत गिर रही है, जबकि जब सूचक LIGHT RED और बढ़ रहा है तो यह देखा जा सकता है कि मंदी की प्रवृत्ति समाप्त हो रही है या स्थिर हो रही है। जब संकेतक के आधार पर तेजी या मंदी की प्रवृत्ति स्थिर हो रही है, तो सख्त स्टॉप-लॉस नियोजित किया जा सकता है, या यहां तक कि पदों को भी उपयुक्त रूप से कम किया जा सकता है।
प्रयोग:
विस्टोर से अटैचमेंट डाउनलोड करें या सीधे अपने टर्मिनल में विस्टोर टैब से इसे राइट क्लिक करके डाउनलोड करें और इंस्टॉल करें चुनें।
इसे अपनी कंपनी VertexFX स्थानीय वीटीएल फ़ाइलें फ़ोल्डर में कॉपी करें, अर्थात C:Users”Username”AppDataRoamingVertexFX Client Terminals”Company name”VTL11Local VTL Scripts
अपने क्लाइंट टर्मिनल को पुनः आरंभ करें या स्क्रिप्ट खोजने के लिए “स्थानीय वीटीएल लिपियों” ट्री नोड पर राइट क्लिक करें।
Additional information
| Plugin-Type | Client VTL – Custom Indicator |
|---|---|
| Compatibility |
Reviews
There are no reviews yet.