$0.00
In stock
BuySell indicator is a simple yet powerful VertexFX client side script that identifies powerful trends. It is based on Moving Average (MA) and Average True Range (ATR), and is primarily used as a signal for trend-following systems.
(Downloads - 2204)

BuySell indicator is a simple yet powerful VertexFX client side script that identifies powerful trends. It is based on Moving Average (MA) and Average True Range (ATR), and is primarily used as a signal for trend-following systems.
Moving Average is a useful indicator that provides feedback about the trend and its direction. A rising Moving Average implies a bullish trend, whereas a falling Moving Average implies a bearish trend. The Average True Range determines the strength of the trend and its movement. A gradually increasing Average True Range implies a strong trend (which can either be bullish or bearish), whereas a falling Average True Range implies exhaustion or sideways movement. By combining these two indicators the BuySell indicator identifies profitable trend-following opportunities.
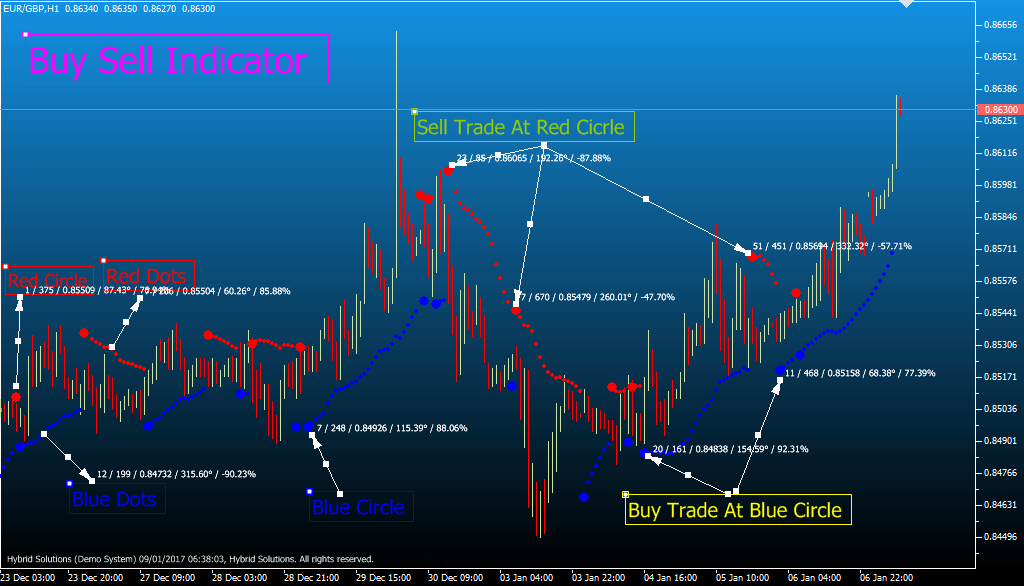
This indicator has four components – blue circles, blue dots, red circles and red dots. It is primarily used in a stop-and-reverse (SAR) trading mechanism.
Interpretation of Indicator
• BLUE CIRCLE – When the direction of the Moving Average switches from downwards to upwards a BLUECIRCLE is drawn at a distance of Average True Range below the Moving Average. This indicates that the trend has changed from bearish to bullish. Enter a BUY position at the close of the candle when a blue circle is displayed.
• BLUE DOT – When the Moving Average is rising, a BLUE DOT is drawn at a distance of Average True Range below the Moving Average. It implies a bullish trend. Place a trailing stop at the swing lowbelow the blue dot if a BUY position is open.
• RED CIRCLE – When the direction of the Moving Average switches from upwards to downwards a red circle is drawn at a distance of Average True Range above the Moving Average. This indicates that the trend has changed from bullish to bearish. Enter a SELL position at the close of the candle when a red circle is displayed.
• RED DOT – When the Moving Average is falling, a red dot is drawn at a distance of Average True Range above the Moving Average. It implies a bearish trend. Place a trailing stop at the swing highabove the red dot if a SELL position is open.
Configurable Inputs:
1.MA_PERIOD –The period over which the Moving Average is calculated.
2.MA_METHOD – The method used to calculate the Moving Average. The allowed values are “MODE_SMA” (Simple Moving Average), “MODE_EMA” (Exponential Moving Average), “MODE_LWMA” (Linear Weighted Moving Average) and “MODE_SMMA” (Smoothed Moving Average).
3.MA_PRICE – The price field used to calculate the Moving Average. The allowed values are “PRICE_OPEN” (Open), “PRICE_HIGH” (High), “PRICE_LOW” (Low), “PRICE_CLOSE” (Close), “PRICE_TYPICAL” (Typical), “PRICE_WEIGHTED” (Weighted), “PRICE_MEDIAN” (Median).
4.ATR_PERIOD – The period over which the Average True Range is calculated.
Usage
- Download the attachment from vStore or directly from the vStore tab in your terminal by performing a right click on it and selecting Download & Install
- Copy it to your company VertexFX Local VTL Files folder i.e. C:ProgramDataVertexFX Client Terminals”Company name”VTL10Local VTL Scripts
- Restart your Client Terminal or Right Click on “Local VTL Scripts” Tree Node to find the script.
Additional information
| Plugin-Type | Client VTL – Custom Indicator |
|---|---|
| Compatibility |


Reviews
There are no reviews yet.