$0.00
In stock
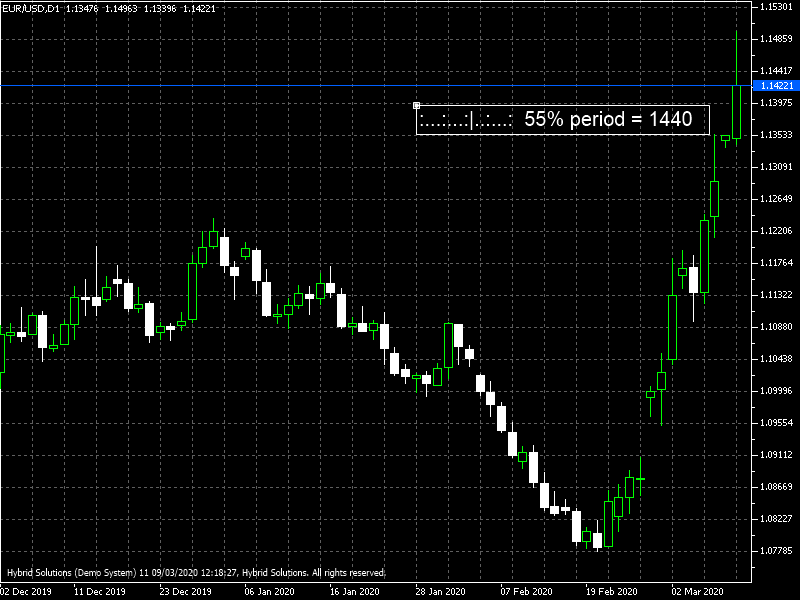
Bar Timer indicator is a handy VertexFX indicator that displays the elapsed time of the current candle as a percentage.
(Downloads - 1069)

Bar Timer indicator is a handy VertexFX indicator that displays the elapsed time of the current candle as a percentage.
Bar Timer indicator identifies the time-frame of the chart on which it is attached. Then calculates the duration of the candle of the chart time-frame in seconds. Next, it detects the number of seconds that have elapsed in the current candle. This is achieved by subtracting the current server time from the opening time of the current candle.
For example, if the indicator is attached to a 15-minute chart, the duration of each candle is 900 seconds (15 minutes multiplied by 60 seconds per minute). The opening time of the latest candle is retrieved and subtracted from the current server time. For example, if the current server time is 10:07:32, and the opening time of the current candle is 10:00:00, then 452 seconds (7 multiplied by 60 plus 32) have elapsed for the current candle. Finally, this is divided by the duration of the candle and expressed as a percentage. So the indicator displays 50.22% (452 divided by 900).
This indicator ensures that the trader is aware of the time remaining before the closing of the current candle and can manage their trading positions accordingly. It is observed that a large number of traders who trade enter and exit trades manually do so at the close of the candle. By attaching this indicator to the chart, the trader is now aware of the amount of time left before the close of the candle and can take decisions accordingly.
The indicator also provides a simple tutorial illustrating the ease of programming chart objects using the VertexFX Trading Language (VTL). The indicator uses the LABEL and RECTANGLE graphic objects and demonstrates how to create these two chart objects, set their positions and sizes, and properties like color, font name, and font size.
The user can configure the font-size, and the location of the output using the FSIZE, XDISTANCE and YDISTANCE input parameters respectively.
Configurable Inputs
1.FSIZE– The font size used to display the indicator data.
2.XDISTANCE– The distance from the left of the chart in pixels to display the indicator data.
3.YDISTANCE– The distance from the top of the chart in pixels to display the indicator data.
Usage
- Download the attachment from vStore or directly from the vStore tab in your terminal by performing a right-click on it and selecting Download & Install
- Copy it to your company VertexFX Local VTL Files folder i.e.C:Users”Username”AppDataRoamingVertexFX Client Terminals“Company name”VTL11Local VTL Scripts
- Restart your Client Terminal or Right Click on “Local VTL Scripts” Tree Node to find the script.
Hindi Version
बार टाइमर सूचक एक संकेतक है जो वर्तमान मोमबत्ती के बीता हुआ समय को प्रतिशत के रूप में प्रदर्शित करता है।
यह चार्ट के समय-फ्रेम की पहचान करता है, जिस पर यह संलग्न है। यह तब चार्ट टाइम-फ्रेम के कैंडल की अवधि को सेकंडों में परिकलित करता है और उन सेकंड की संख्या का पता लगाता है जो वर्तमान मोमबत्ती में बीते हैं। यह वर्तमान सर्वर समय को वर्तमान मोमबत्ती के उद्घाटन समय से घटाकर प्राप्त किया जाता है।
उदाहरण के लिए, यदि संकेतक 15 मिनट के चार्ट से जुड़ा हुआ है, तो प्रत्येक मोमबत्ती की अवधि 900 सेकंड (15 मिनट प्रति मिनट 60 सेकंड से गुणा) है।
नवीनतम मोमबत्ती का शुरुआती समय वर्तमान सर्वर समय से पुनर्प्राप्त और घटाया जाता है।
उदाहरण के लिए यदि वर्तमान सर्वर का समय 10:07:32 है, और वर्तमान मोमबत्ती का खुलने का समय 10:00:00 है, तो वर्तमान मोमबत्ती के लिए 452 सेकंड (60 से 32 गुणा 7 गुणा) बीत चुके हैं।
अंत में, यह मोमबत्ती की अवधि से विभाजित है, और प्रतिशत के रूप में व्यक्त किया गया है। तो संकेतक 50.22% (जिसका अर्थ है 452 को 900 से विभाजित) प्रदर्शित करता है।
यह संकेतक यह सुनिश्चित करता है कि व्यापारी को वर्तमान मोमबत्ती के बंद होने से पहले शेष समय के बारे में पता है और तदनुसार अपने व्यापारिक पदों का प्रबंधन कर सकता है।
यह देखा गया है कि बड़ी संख्या में व्यापारी, जो मोमबत्ती के बंद होने पर मैन्युअल रूप से ट्रेडों में प्रवेश और निकास करते हैं। इस संकेतक को चार्ट में संलग्न करके, व्यापारी को अब मोमबत्ती के बंद होने से पहले शेष समय की मात्रा के बारे में पता है और तदनुसार निर्णय ले सकता है।
संकेतक वर्टेक्सएफएक्स ट्रेडिंग लैंग्वेज (वीटीएल) का उपयोग करके प्रोग्रामिंग चार्ट ऑब्जेक्ट्स की आसानी को दर्शाता हुआ एक सरल ट्यूटोरियल भी प्रदान करता है।
सूचक LABEL और RECTANGLE ग्राफ़िक ऑब्जेक्ट का उपयोग करता है और दर्शाता है कि इन दो चार्ट ऑब्जेक्ट को कैसे बनाया जाए, उनके स्थान और आकार, और रंग, फ़ॉन्ट नाम और फ़ॉन्ट आकार जैसे गुण सेट करें।
ट्रेडर फ़ॉन्ट-आकार, और क्रमशः FSIZE, XDISTANCE और YDISTANCE इनपुट मापदंडों का उपयोग करके आउटपुट का स्थान कॉन्फ़िगर कर सकता है।
प्रयोग:
विस्टोर से अटैचमेंट डाउनलोड करें या सीधे अपने टर्मिनल में विस्टोर टैब से इसे राइट क्लिक करके डाउनलोड करें और इंस्टॉल करें चुनें।
इसे अपनी कंपनी VertexFX स्थानीय वीटीएल फ़ाइलें फ़ोल्डर में कॉपी करें, अर्थात C:Users”Username”AppDataRoamingVertexFX Client Terminals”Company name”VTL11Local VTL Scripts
अपने क्लाइंट टर्मिनल को पुनः आरंभ करें या स्क्रिप्ट खोजने के लिए “स्थानीय वीटीएल लिपियों” ट्री नोड पर राइट क्लिक करें।
Additional information
| Plugin-Type | Client VTL – Custom Indicator |
|---|---|
| Compatibility |

