$0.00
In stock
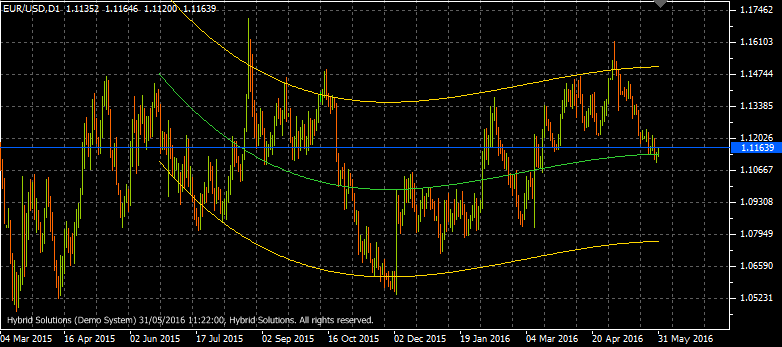
i-Regr is a powerful VertexFX client-side VTL indicator used to calculate and display regression data for a specific chart.
It is used to identify sideways and trending markets using the 1st degree regression, and the market cycles using the 2nd and 3rd degree regressions.
(Downloads - 1858)

i-Regr is a powerful VertexFX client-side VTL indicator used to calculate and display regression data for a specific chart.
It is used to identify sideways and trending markets using the 1st degree regression, and the market cycles using the 2nd and 3rd degree regressions.
It has three modes of operation, configured based on the DEGREE input parameter –
1. Linear Regression Mode – As the name implies, it displays three lines, the middle GREEN line which is the linear regression line, one yellow line each above and below the middle GREEN line. The two YELLOW lines are KSTD times the standard deviation away from the middle GREEN line. When the prices are restricted within the outside YELLOW lines, it is clearly that volatility is below KSTD number of standard deviations.
Hence, breakout trades can be placed beyond these two YELLOW lines.
2. Parabolic Regression Mode –The Parabolic Regression Mode is the 2nd degree regression mode using 2nd power filters to calculate the regression lines instead of first power (linear) regression.
This version is to detect the duration of the market cycle using parabolic regression analysis. The market cycle is the number of bars between the indicators (GREEN) high and low. This tells us the typical duration of the current trend. If the current trend is longer than this market cycle, we can choose the exit the trade.
Breakout trades can be placed above and below the YELLOW lines.
3. Polynomial (Third Power Regression Mode) – The Polynomial Regression Mode is the 3rd degree regression mode using 3rd power filters to calculate the regression lines.
In this method we calculate the amplitude of the market cycle, which is the difference between the highest and lowest values of the GREEN line. This tells us the amount of price movement possible from the current price in either direction.
Breakout trades can be placed above and below the YELLOW lines.
Please Note that if the chart does not have sufficient number of bars available for calculations, a message is displayed. In such case, the user can reduce the value of the BarsCount parameter, of try running the indicator again after loading more chart data using the “Load All Chart Data” button in the Charts tab.
Configurable Inputs
1. DEGREE – Specifies the degree of the regression lines. The allowed values are 1 (Linear Regression), 2 (Parabolic Regression), 3 (Third Power Polynomial Regression).
2. KSTD – The number of standard deviations used to create the upper and lower bands based on the central (middle) regression line.
3. BarsCount – The number of bars over which to calculate the i-Regr indicator.
4. SHIFT – The number of bars to shift the calculated values to the right.
Usage
- Download the attachment from vStore or directly from the vStore tab in your terminal by performing a right click on it and selecting Download & Install
- Copy it to your company VertexFX Local VTL Files folder i.e. C:ProgramDataVertexFX Client Terminals”Company name”VTL10Local VTL Scripts
- Restart your Client Terminal or Right Click on “Local VTL Scripts” Tree Node to find the script.
Additional information
| Plugin-Type | Client VTL – Custom Indicator |
|---|---|
| Compatibility |

