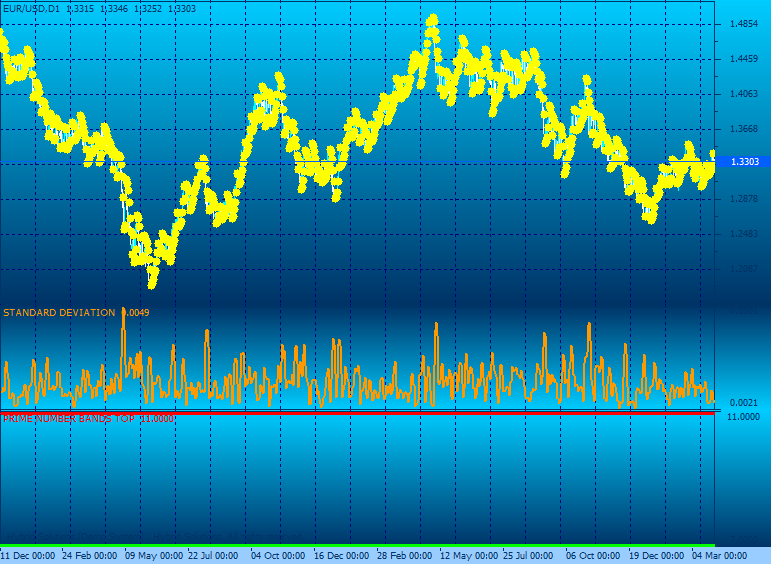
Contains
- Parabolic Sar: idea of an indicator is to buy into up trends when the indicator is below price, and sell into down trends when the indicator is above price;
- Standard Deviation: measures how widely values (closing prices for instance) are dispersed from the average;
- Prime Number Bands: identifies the nearest prime number for the high and low and plots the two series as bands.
Parameters
- Parabolic SAR: Step (float), Maximum (float);
- Standard Deviation: Period (integer); Method (Simple, Exponential, Time Series, Variable, VIDYA, Weighted), Stand Dev (integer);
- Prime Number Bands.
Image

Usage
- Download the attachment.
- Copy it to your company VertexFX templates folder i.e. C:Program FilesCompany Nametemplates
- Restart your Client Terminal to apply.
- The Template can be found by going to Technical Analysis Tab -> Templates.
Additional information
| Plugin-Type | Client – Chart Template |
|---|---|
| Compatibility |

