$0.00
In stock
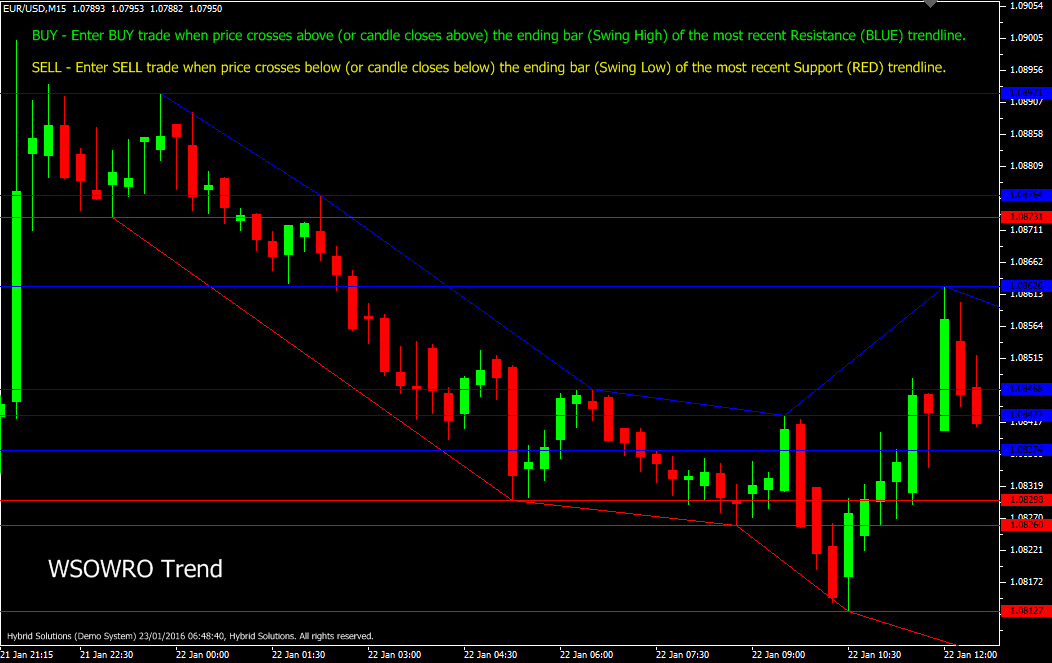
WSOWRO Trend indicator is a powerful VertexFX client-side indicator provides traders with critical Support and Resistance levels.
(Downloads - 1605)

WSOWRO Trend indicator is a powerful VertexFX client-side indicator provides traders with critical Support and Resistance levels. In addition to the Support and Resistance levels, it also provides traders with Support and Resistance trendlines. The concept behind this indicator is that the Support and Resistance levels form critical levels, which when broken signal a change in the market direction. In addition to the break of the Support and Resistance levels, if the price also breaks the Support and Resistance trendline swing points.
The indicator comprises of six horizontal Resistance (Blue) levels, and six horizontal Support (Red) levels. These levels are calculated over the recent LIMIT bars. It is possible for the Resistance levels to exist below the current price, and similarly for the Support levels to exist above the current price. This is because levels are calculated over the recent LIMIT period, where the prices may have been below and above the current price.
Similarly, there are five Resistance (Blue) trendlines, and five Support (Red) trendlines. Each horizontal Resistance (Blue) level can be considered as a stop-loss level for Sell trades, or entry level for Buy trades. Similarly, each horizontal (Red) level can be considered as a stop-loss level for Buy trades, or entry level for Sell trades.
The indicator uses the High and Low prices to calculate the levels and trendlines. A level is considered a Support level if the Lowest Low of the recent PERIOD bars is same as the Low of the recent PERIOD divided by two bars. These should be the same bar. Similarly, a level is considered a Resistance level if the Highest High of the recent PERIOD bars is same as the High of the recent PERIOD divided by two bars. These should be the same bar.
| BUY | Place Buy trade when price crosses above (or candle closes above) the ending bar (Swing High) of the most recent Resistance (Blue) trendline. Do not open Buy trade if candle has gap-up opening. Place stop-loss below the nearest Support level or nearest Swing Low level. |
| SELL | Place Sell trade when price crosses below (or candle closes below) the ending bar (Swing Low) of the most recent Support (Red) trendline. Do not open Sell trade if candle has gap-down opening. Place stop-loss above the nearest Resistance level or nearest Swing High level. |
Usage
- Download the attachment from vStore or directly from the vStore tab in your terminal by performing a right click on it and selecting Download & Install
- Copy it to your company VertexFX Local VTL Files folder i.e. C:ProgramDataVertexFX Client Terminals”Company name”VTL10Local VTL Scripts
- Restart your Client Terminal or Right Click on “Local VTL Scripts” Tree Node to find the script.
Additional information
| Plugin-Type | Client VTL – Custom Indicator |
|---|---|
| Compatibility |

