$0.00
In stock
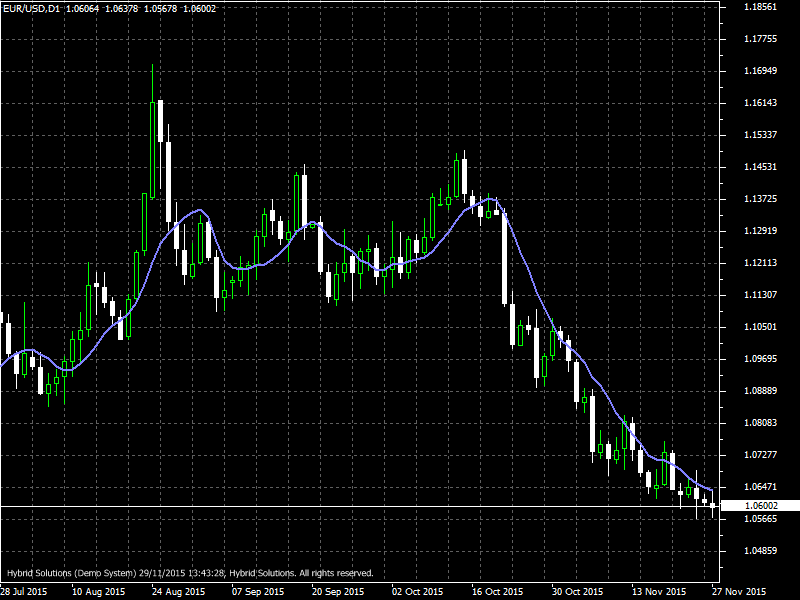
Volume-Weighted Average Price (VWAP) is a VertexFX Client side VTL indicator , that is used to identify liquidity points. As volume-weighted price measure, VWAP reflects price levels weighted by volume. This can help institutions with large orders.
(Downloads - 1601)

Volume-Weighted Average Price (VWAP) is a VertexFX Client side VTL indicator , that is used to identify liquidity points. As volume-weighted price measure, VWAP reflects price levels weighted by volume. This can help institutions with large orders.
The idea behind this indicator is not to disrupt the market when entering large buy or sell orders. VWAP helps these institutions determine the liquid and illiquid price points for a specific security over a very short time period. VWAP can also be used to measure trading efficiency. After buying or selling a security, institutions or individuals can compare their price to VWAP values. A buy order executed below the VWAP value would be considered a good fill because the security was bought at a below average price. Conversely, a sell order executed above the VWAP would be deemed a good fill because it was sold at an above average price.
The indicator has two parameters that you can change. You can change the variable N, which determines the number of bars to be used for calculating the value of the indicator. And set the length of the display indicator with a value limit.
VWAP serves as a reference point for prices for one day. As such, it is best suited for intraday analysis. Chartists can compare current prices with the VWAP values to determine the intraday trend. Keep in mind that VWAP is a cumulative indicator, which means the number of data points progressively increases throughout the day.
Volume-Weighted Average Price (VWAP) can be plotted as an “overlay” indicator on Sharpcharts. After entering the security symbol, choose an “intraday” period and a “range.” This can be for 1 day or “fill the chart.” Chartists looking for more detail can choose “fill the chart.” Chartist looking for general levels can choose 1 day. VWAP can be plotted over more than one day, but the indicator will jump from its prior closing value to the typical price for the next open as a new calculation period begins. Also note that VWAP values can sometimes fall off the price chart. VWAP at 45.5 will be show up on a chart with a price range from 45.8 to 47. Chartists sometimes need to extend the range to a full day to see VWAP on the chart.
Usage
- Download the attachment from vStore or directly from the vStore tab in your terminal by performing a right click on it and selecting Download & Install
- Copy it to your company VertexFX Local VTL Files folder i.e. C:ProgramDataVertexFX Client Terminals”Company name”VTL10Local VTL Scripts
- Restart your Client Terminal or Right Click on “Local VTL Scripts” Tree Node to find the script.
Additional information
| Plugin-Type | Client VTL – Custom Indicator |
|---|---|
| Compatibility |

