$0.00
In stock
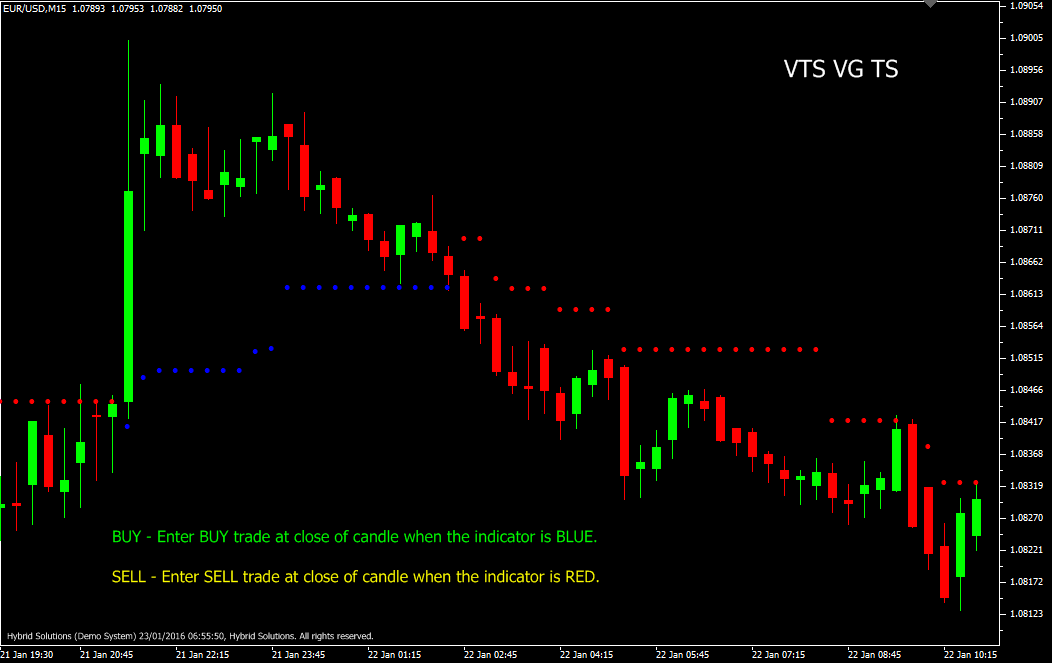
VTS VG TS is an innovative and powerful VertexFX client side indicator that provides precise Buy and Sell signals along with Support and Resistance levels. The concept behind this indicator is that the Average True Range (ATR) provides valuable trading range bands based on range expansion or consolidation. When the market is consolidating, the price band is narrow and therefore the ATR value is lower. On the contrary, when the market is expanding, the price band is wider and therefore the ATR value is greater. When the market moves from a smaller ATR value to a greater ATR value, it signals the start of a trend, and the slope of the change indicates the strength of the trend.
(Downloads - 1593)

VTS VG TS is an innovative and powerful VertexFX client side indicator that provides precise Buy and Sell signals along with Support and Resistance levels. The concept behind this indicator is that the Average True Range (ATR) provides valuable trading range bands based on range expansion or consolidation. When the market is consolidating, the price band is narrow and therefore the ATR value is lower. On the contrary, when the market is expanding, the price band is wider and therefore the ATR value is greater. When the market moves from a smaller ATR value to a greater ATR value, it signals the start of a trend, and the slope of the change indicates the strength of the trend.
At first step we calculate the Average True Range over the ATR PERIOD. We then calculate the upper and lower trading bands based upon the Average True Range. The upper band is calculated by adding the Close price to the product of the Average True Range and the ATR MULTIPLIER. Similarly, the lower band is calculated by subtracting the product of the Average True Range and the ATR MULTIPLIER from the Close price.
The upper and lower bands are used to calculate the BUY and SELL trigger levels. The Buy and Sell trigger points are calculated using 30 levels. We alternately find the minimum and maximum values of the upper band and the lower band. A blue (Buy) signal is generated if the close is above the Buy trigger level. Likewise, a Red (Sell) signal is generated if the close is below the Sell trigger level. The Blue level can also be used as strong Support level for bullish trades, whereas the Red level can be used as strong Resistance level for bearish trades.
| BUY | Place Buy position at close of candle when the indicator is Blue. Do not open buy trade if the candle has a gap up opening. Place stop-loss below the nearest swing low. |
| SELL | Place Sell position at close of candle when the indicator is Red. Do not open sell trade if the candle has a gap down opening. Place stop-loss above the nearest swing high. |
Additional information
| Plugin-Type | Client VTL – Custom Indicator |
|---|---|
| Compatibility |

