$0.00
In stock
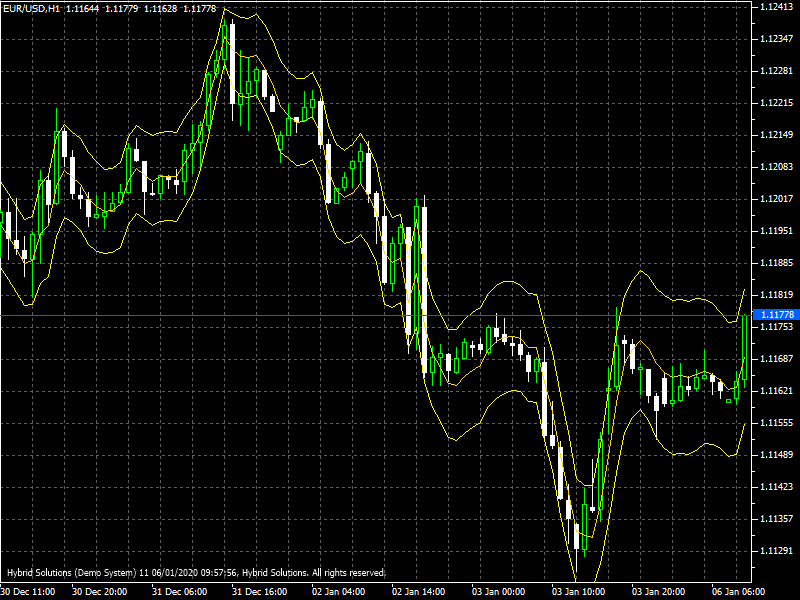
Volatility Bands is a VertexFX indicator that consists of three bands designed to encompass most of the security’s price action. Volatility Bands are plotted at volatility levels above and below a moving average.
(Downloads - 1152)

Volatility Bands is a VertexFX indicator that consists of three bands designed to encompass most of the security’s price action. Volatility Bands are plotted at volatility levels above and below a moving average. A distinct characteristic of Volatility Bands is how the spacing between bands varies based on the volatility of prices.
Like Bollinger Bands, the bands are self-adjusting: widening during volatile markets and contracting during calmer or trending periods. Volatility bands can help confirm the trend, but they do not determine the future direction of security.
In an uptrend when the price reaches the lower band buy position can be opened. In a downtrend, when the price reaches the band top sell is recommended.
Parameters:
Length – Periods to calculate Bands
Price – Price to use; 0-Close, 1-Open, 2-High, 3-Low, 4-Median, 5-Weighted Close
Deviations – Standard Deviation in Volatility Calculation
UseClassicalDeviations – TRUE Standard Deviation is used for Bands, FALSE – Volatility is used for bands
Usage
- Download the attachment from vStore or directly from the vStore tab in your terminal by performing a right-click on it and selecting Download & Install
- Copy it to your company VertexFX Local VTL Files folder i.e.C:Users”Username”AppDataRoamingVertexFX Client Terminals“Company name”VTL11Local VTL Scripts
- Restart your Client Terminal or Right Click on “Local VTL Scripts” Tree Node to find the script.
Hindi Version:
अस्थिरता बैंड बोलिंगर बैंड की अवधारणा पर आधारित है। अंतर यह है कि अस्थिरता का उपयोग मानक विचलन के बजाय बैंड के रूप में किया जाता है। यह उपयोगकर्ताओं को एक समय अवधि में अस्थिरता और सापेक्ष मूल्य स्तरों की तुलना करने की अनुमति देता है। संकेतक में तीन बैंड होते हैं जिन्हें अधिकांश सुरक्षा मूल्य की कार्रवाई को शामिल करने के लिए डिज़ाइन किया गया है। अस्थिरता बैंड एक चलती औसत से ऊपर और नीचे अस्थिरता के स्तर पर प्लॉट किए जाते हैं। अस्थिरता बैंड की एक अलग विशेषता यह है कि बैंड की कीमतों के अंतर के आधार पर बैंड के बीच अंतर कैसे होता है।
बोलिंगर बैंड की तरह, बैंड आत्म-समायोजन हैं: अस्थिर बाजारों के दौरान चौड़ीकरण और शांत या ट्रेंडिंग अवधि के दौरान अनुबंध। अस्थिरता बैंड प्रवृत्ति की पुष्टि करने में मदद कर सकते हैं, लेकिन वे भविष्य की सुरक्षा की दिशा निर्धारित नहीं करते हैं।
एक अपट्रेंड में जब कीमत कम बैंड तक पहुंचती है तो खरीद की स्थिति को खोला जा सकता है। डाउन ट्रेंड में, जब कीमत पहुंचती है तो बैंड की टॉप सेल की सिफारिश की जाती है।
पैरामीटर:
Length – बैंड की गणना करने के लिए अवधि
Price – उपयोग करने की कीमत; 0-क्लोज, 1-ओपन, 2-हाई, 3-लो, 4-मेडियन, 5-वेटेड क्लोज
Deviations – अस्थिरता गणना में मानक विचलन
UseClassicalDeviations – TRUE मानक विचलन का उपयोग बैंड, FALSE के लिए किया जाता है – अस्थिरता का उपयोग बैंड के लिए किया जाता है
प्रयोग:
विस्टोर से अटैचमेंट डाउनलोड करें या सीधे अपने टर्मिनल में विस्टोर टैब से इसे राइट क्लिक करके डाउनलोड करें और इंस्टॉल करें चुनें।
इसे अपनी कंपनी VertexFX स्थानीय वीटीएल फ़ाइलें फ़ोल्डर में कॉपी करें, अर्थात C:Users”Username”AppDataRoamingVertexFX Client Terminals”Company name”VTL10Local VTL Scripts
अपने क्लाइंट टर्मिनल को पुनः आरंभ करें या स्क्रिप्ट खोजने के लिए “स्थानीय वीटीएल लिपियों” ट्री नोड पर राइट क्लिक करें।
Additional information
| Plugin-Type | Client VTL – Custom Indicator |
|---|---|
| Compatibility |

