$0.00
In stock
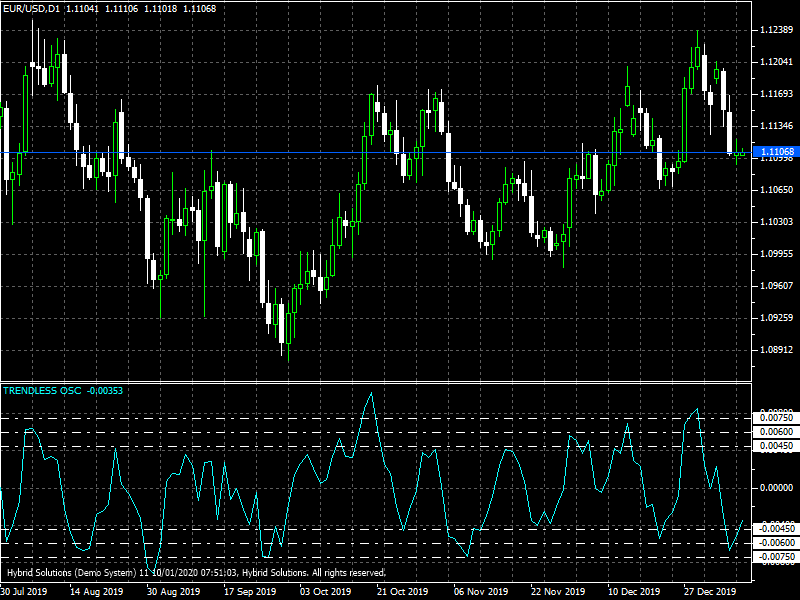
The basic idea of the Trendless Oscillator is when it is above 0, it is an uptrend and when below 0, it is a downtrend. It is designed to show overbought oversold situations too. When it reaches an extreme level above 0
(Downloads - 1133)

Trendless Oscillator was developed by Joe DiNapoli and described in his book, Trading with DiNapoli levels. It used with Fibonacci Levels to open trades. However, it can be used as a standalone indicator or with other indicators and support resistance levels.
Formula
TrendlessOscillator = Close – Simple Moving Average of close with period 7
The basic idea of the Trendless Oscillator is when it is above 0, it is an uptrend and when below 0, it is a downtrend. It is designed to show overbought oversold situations too. When it reaches an extreme level above 0, the instrument is considered in an overbought situation. This may lead to consolidation or trend reversal. Many times, trend pauses and continues in the original direction. The overbought levels are used as profit booking levels. The extreme levels in this indicator is a relative term, observe the charts and find the extreme levels indicator reached historically. This depends on the volatility of the instrument.
Another method to use the oscillator is divergence. When price makes new high and oscillator fails to reach a new high, there is a divergence between price and oscillator. This happens when the trend is losing strength, and eventually, leads to a reversal of the trend.
Usage
- Download the attachment from vStore or directly from the vStore tab in your terminal by performing a right-click on it and selecting Download & Install
- Copy it to your company VertexFX Local VTL Files folder i.e.C:Users”Username”AppDataRoamingVertexFX Client Terminals“Company name”VTL11Local VTL Scripts
- Restart your Client Terminal or Right Click on “Local VTL Scripts” Tree Node to find the script.
Hindi Version:
ट्रेंडलेस ऑस्किलेटर जो जोनापोली द्वारा विकसित किया गया था और अपनी पुस्तक, ट्रेडिंग इन दिनेपोली के स्तरों के साथ वर्णित किया गया था। ट्रेडों को खोलने के लिए इसका इस्तेमाल फिबोनाची स्तरों के साथ किया जाता है। हालांकि, इसका उपयोग स्टैंडअलोन संकेतक के रूप में या अन्य संकेतकों और समर्थन प्रतिरोध स्तरों के साथ किया जा सकता है।
TrendlessOscillator = Close – Simple Moving Average of close with period 7
ट्रेंडलेस ऑसिलेटर का मूल विचार यह है कि यह 0 से ऊपर है, यह अपट्रेंड है और जब 0 से नीचे है, तो यह डाउन ट्रेंड है। यह ओवरबॉट ओवरसोल्ड स्थितियों को भी दिखाने के लिए बनाया गया है। जब यह 0 से ऊपर के चरम स्तर पर पहुंच जाता है, तो साधन को एक ओवरबॉट स्थिति में माना जाता है। इससे समेकन या प्रवृत्ति उलट हो सकती है। कई बार, प्रवृत्ति रुक जाती है और मूल दिशा में जारी रहती है। ओवरबॉट का स्तर लाभ बुकिंग स्तर के रूप में उपयोग किया जाता है। इस सूचक में चरम स्तर एक सापेक्ष शब्द है, चार्ट का निरीक्षण करें और चरम स्तर के संकेतक को ऐतिहासिक रूप से प्राप्त करें। यह साधन की अस्थिरता पर निर्भर करता है।
थरथरानवाला का उपयोग करने का एक और तरीका विचलन है। जब कीमत नई ऊँची हो जाती है और थरथरानवाला नई ऊँचाई तक पहुँचने में विफल हो जाता है, तो मूल्य और थरथरानवाला के बीच विचलन होता है। यह तब होता है जब प्रवृत्ति शक्ति खो रही होती है, और अंततः प्रवृत्ति के उलट हो जाती है।
प्रयोग:
विस्टोर से अटैचमेंट डाउनलोड करें या सीधे अपने टर्मिनल में विस्टोर टैब से इसे राइट क्लिक करके डाउनलोड करें और इंस्टॉल करें चुनें।
इसे अपनी कंपनी VertexFX स्थानीय वीटीएल फ़ाइलें फ़ोल्डर में कॉपी करें, अर्थात C:Users”Username”AppDataRoamingVertexFX Client Terminals”Company name”VTL10Local VTL Scripts
अपने क्लाइंट टर्मिनल को पुनः आरंभ करें या स्क्रिप्ट खोजने के लिए “स्थानीय वीटीएल लिपियों” ट्री नोड पर राइट क्लिक करें।
Additional information
| Plugin-Type | Client VTL – Custom Indicator |
|---|---|
| Compatibility |

