$0.00
In stock
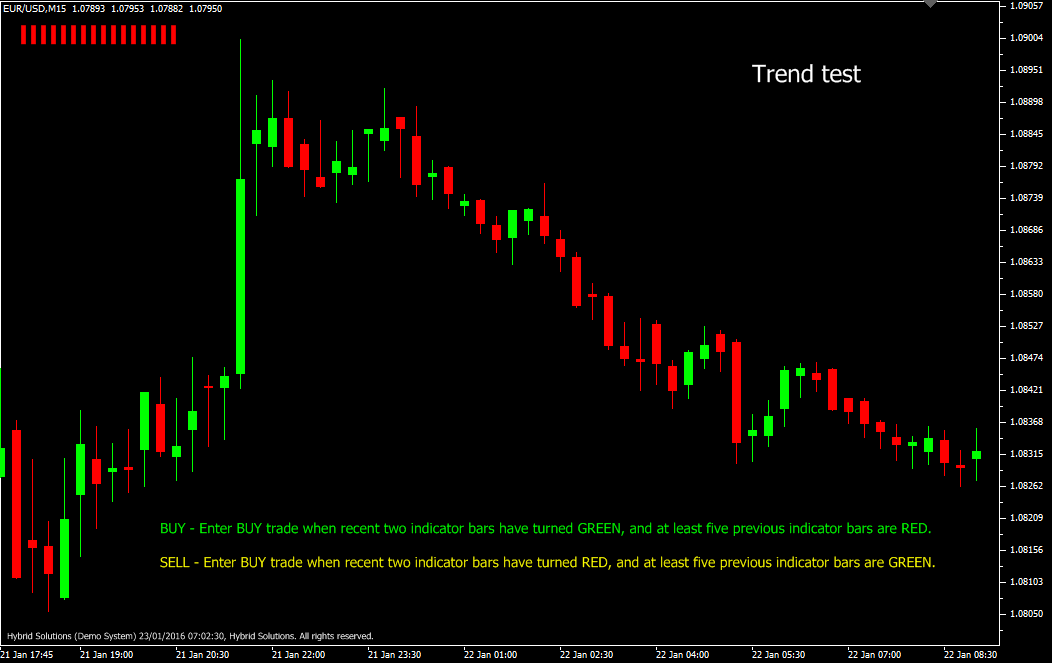
Trend test indicator is a powerful VerterFX client-side indicator that provides us precise Buy and Sell signals based upon trend-following techniques. The indicator employs long-term (200 bars) trend-following mechanism. It consists of 16 bars which are marked as bullish (Green), bearish (Red) and neutral (Gray). The leftmost bar represents the older trend, and the rightmost bar represents the more recent trend.
(Downloads - 1862)

Trend test indicator is a powerful VerterFX client-side indicator that provides us precise Buy and Sell signals based upon trend-following techniques. The indicator employs long-term (200 bars) trend-following mechanism. It consists of 16 bars which are marked as bullish (Green), bearish (Red) and neutral (Gray). The leftmost bar represents the older trend, and the rightmost bar represents the more recent trend.
Each bar is calculated by comparing the 200-period Exponential Moving Average (EMA) against the 200-period Exponential Moving Average (EMA) two bars ago. We avoid comparison with the immediate previous bar to eliminate spikes and whipsaws. When the current 200-period EMA is above the 200-period EMA two bars ago, that particular bar is marked as bullish (Green). Similarly, when the current 200-period EMA is below the 200-period EMA of two bars ago that particular bar is marked bearish (Red). If the EMAs are equal, or not available, the bar is marked as (Gray).
In an uptrend, as the price rises, the EMA also rises steadily. As soon as the latest two indicator bars turn Green from Red, it confirms that uptrend is strong. Similarly, in a downtrend as the price falls, the EMA also falls steadily. As soon as the latest two indicator bars turn Red from Geen, it confirms that the downtrend is strong.
| BUY | Place Buy trade when recent two indicator bars have turned Green, and at least five previous indicator bars are Red. Do not open Buy trade if candle has gap-up opening. Place stop-loss below the nearest Swing Low level. |
| SELL | Place Sell trade when recent two indicator bars have turned Red, and at least five previous indicator bars are Green. Do not open Sell trade if candle has gap-down opening. Place stop-loss above the nearest Swing High level. |
Usage
- Download the attachment from vStore or directly from the vStore tab in your terminal by performing a right click on it and selecting Download & Install
- Copy it to your company VertexFX Local VTL Files folder i.e. C:ProgramDataVertexFX Client Terminals”Company name”VTL10Local VTL Scripts
- Restart your Client Terminal or Right Click on “Local VTL Scripts” Tree Node to find the script.
Additional information
| Plugin-Type | Client VTL – Custom Indicator |
|---|---|
| Compatibility |

