$0.00
In stock
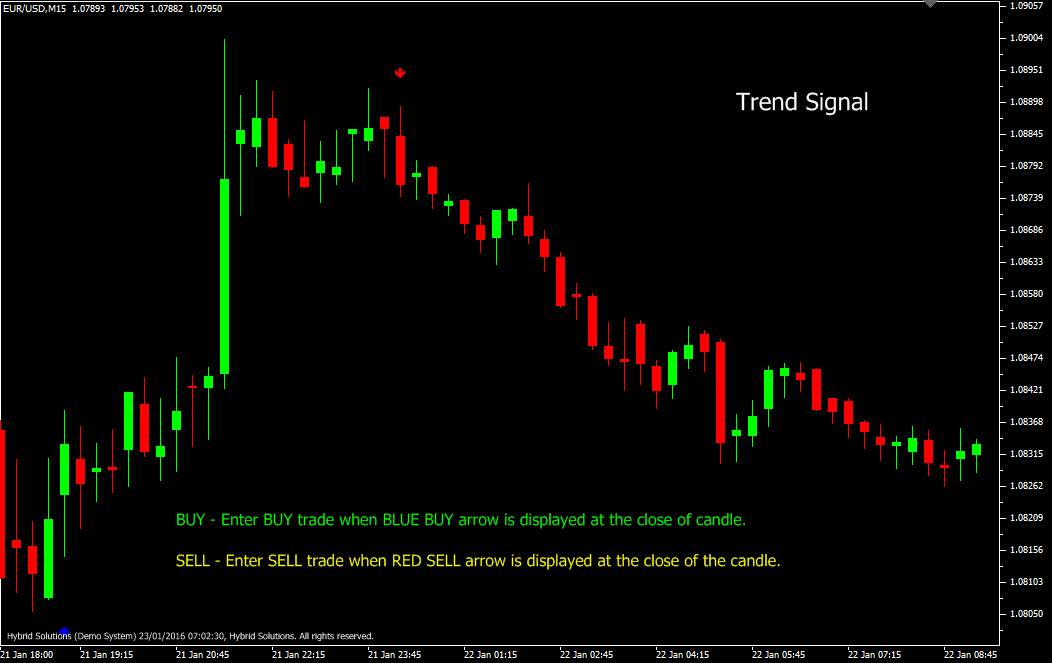
Trend Signal indicator is a powerful VertexFX client-side indicator that gives precise Buy and Sell signals based on breakouts and market turn arounds. It is based breakout strategy of key Support and Resistance levels. The concept behind this indicator is that the market exhibits critical Support and Resistance levels, which when decisively broken signal a change in direction of the trend.
(Downloads - 1747)

Trend Signal indicator is a powerful VertexFX client-side indicator that gives precise Buy and Sell signals based on breakouts and market turn arounds. It is based breakout strategy of key Support and Resistance levels. The concept behind this indicator is that the market exhibits critical Support and Resistance levels, which when decisively broken signal a change in direction of the trend.
At first step, we calculate the Highest High value over the recent 9 candles. In the next step, we calculate the Lowest Low value over the recent 9 candles. The K factor, which is a smoothing constant is derived by subtracting RISK from 33.We not calculate the upper and lower bands based on the Highest High, Lowest Low range and the K factor.
The difference between the Highest High and Lowest Low is multiplied by the K factor (which is 30) and then divided by 100. In other words, assuming RISK is 3, we calculate the band of 30% of the trading range over the recent 9 candles. This value is subtracted from the Highest High to derive the upper trading band. Likewise, it is added to the Lowest Low to derive the lower trading band.
When the price closes above the lower trading Band for the first time, a Buy signal is generated. This implies that the price has broken above the lower trading band and hence an uptrend is very likely. Similarly, when the price closes below the upper trading band for the first time, a Sell signal is generated. This implies that the price has broken below the upper trading band and hence a downtrend is very likely.
| BUY | Place Buy trade when Blue Buy arrow is displayed at the close of candle. Do not open Buy trade if candle has gap-up opening. Place stop-loss below the nearest Support level or nearest Swing Low level. |
| SELL | Place Sell trade when Red Sell arrow is displayed at the close of the candle. Do not open Sell trade if candle has gap-down opening. Place stop-loss above the nearest Resistance level or nearest Swing High level. |
Usage
- Download the attachment from vStore or directly from the vStore tab in your terminal by performing a right click on it and selecting Download & Install
- Copy it to your company VertexFX Local VTL Files folder i.e. C:ProgramDataVertexFX Client Terminals”Company name”VTL10Local VTL Scripts
- Restart your Client Terminal or Right Click on “Local VTL Scripts” Tree Node to find the script.
Additional information
| Plugin-Type | Client VTL – Custom Indicator |
|---|---|
| Compatibility |

