$0.00
In stock
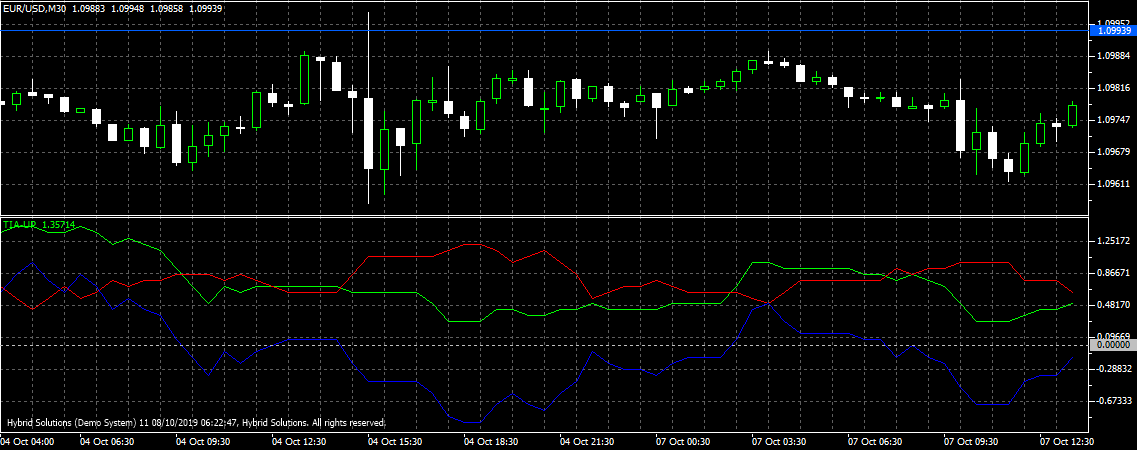
Trend Interruption Average (TIA) is a powerful VertexFX indicator based on Moving Average that is useful in identifying price swings and the strength of a trend.
(Downloads - 1104)

Trend Interruption Average (TIA) is a powerful VertexFX indicator based on Moving Average that is useful in identifying price swings and the strength of a trend.
In an uptrending market we see consecutive positive closes. Likewise, in a downtrending market we see consecutive negative closes. The TIA indicator uses the positive / negative consecutive closes to calculate the strength of the trend and potential reversal. The TIA comprises of three components, namely the TIA-Up (GREEN) line, the TIA-Down (RED) line, and the TIA-Difference (BLUE) line.
Calculation:
In the first step, we calculate the cumulative sum of positive closes. If the current close is above previous close, it is assigned a value of 1. If next candle closes above current close, the cumulative count is increment by 1, otherwise it is reset to 0. For example, if there were three consecutive positive closes, the value of cumulative count will be 1, 2 and 3 for the recent three candles. Similarly, the opposite logic is employed for negative closes – we calculate the cumulative sum of the negative closes separately.
In the next step, we calculate the moving average of the cumulative positive closes and negative closes using the MA_PERIOD. The moving average of the cumulative positive closes is the TIA-Up (GREEN) line, and that of the cumulative negative closes is the TIA-Down (RED) line. The TIA-Difference (BLUE) line is the difference between the TIA-Up and TIA-Down.
When the TIA-Up is rising it implies a bullish trend, whereas when the TIA-Down is rising it implies a bearish trend.
BUY / EXIT SHORT – Place Long position (or exit Short position) at the close of the candle when the TIA-Up (GREEN) line closes above the TIA-Down (RED) line. The stop-loss can be placed below the nearest Swing Low.
SELL/ EXIT LONG – Place Short (or exit Long position) at the close of the candle when the TIA-Down (RED) line closes above the TIA-Up (GREEN) line. The stop-loss can be placed above the nearest Swing High.
Usage
- Download the attachment from vStore or directly from the vStore tab in your terminal by performing a right-click on it and selecting Download & Install
- Copy it to your company VertexFX Local VTL Files folder i.e.C:Users”Username”AppDataRoamingVertexFX Client Terminals“Company name”VTL11Local VTL Scripts
- Restart your Client Terminal or Right Click on “Local VTL Scripts” Tree Node to find the script.
Hindi Version:
ट्रेंड इंटरप्टियन एवरेज (टीआईए) एक शक्तिशाली वर्टेक्सएफएक्स क्लाइंट-साइड इंडिकेटर है जो मूविंग औसत और प्रवृत्ति की ताकत की पहचान करने में उपयोगी है।
एक बेहतर बाजार में हम लगातार सकारात्मक बंद देखते हैं। इसी तरह, नीचे के बाजार में हम लगातार नकारात्मक बंद देखते हैं। TIA सूचक प्रवृत्ति और संभावित उलट की ताकत की गणना करने के लिए सकारात्मक / नकारात्मक लगातार बंद का उपयोग करता है। TIA में तीन घटक होते हैं, अर्थात् TIA-Up (GREEN) लाइन, TIA-Down (RED) लाइन, और TIA-अंतर (BLUE) लाइन।
पहले चरण में, हम सकारात्मक समापन की संचयी राशि की गणना करते हैं। यदि वर्तमान करीबी पिछले करीबी से ऊपर है, तो इसे 1 का मान दिया गया है। यदि अगली मोमबत्ती वर्तमान पास के ऊपर बंद हो जाती है, तो संचयी गणना 1 से बढ़ जाती है, अन्यथा यह 0. पर रीसेट हो जाती है, उदाहरण के लिए, यदि लगातार तीन सकारात्मक बंद थे हाल की तीन मोमबत्तियों के लिए संचयी गिनती का मूल्य 1, 2 और 3 होगा। इसी तरह, नकारात्मक बंदों के लिए विपरीत तर्क नियोजित है – हम नकारात्मक बंदों के संचयी योग की गणना अलग से करते हैं।
अगले चरण में, हम MA_PERIOD का उपयोग करते हुए संचयी सकारात्मक क्लोज और नेगेटिव क्लोज के मूविंग एवरेज की गणना करते हैं। संचयी पॉजिटिव क्लोज़ की चलती औसत TIA-Up (GREEN) लाइन है, और संचयी नकारात्मक क्लोज़ की TIA-Down (RED) लाइन है। TIA- अंतर (BLUE) लाइन TIA-Up और TIA-Down के बीच का अंतर है।
जब टीआईए-अप बढ़ रहा है, तो यह एक तेजी की प्रवृत्ति का अर्थ है, जबकि जब टीआईए-डाउन बढ़ रहा है तो इसका मतलब है कि एक मंदी की प्रवृत्ति।
BUY / EXIT SHORT – TIA-Up (GREEN) लाइन TIA-Down (RED) लाइन के ऊपर बंद होने पर मोमबत्ती के पास स्थित LONG (या SHORT) से बाहर निकलें। स्टॉप-लॉस को निकटतम स्विंग लो के नीचे रखा जा सकता है।
SHORT / EXIT LONG – TIA-Down (RED) लाइन TIA-Up (GREEN) लाइन के ऊपर बंद होने पर SHORT (या LONG) से बाहर निकलें। स्टॉप-लॉस को निकटतम स्विंग उच्च के ऊपर रखा जा सकता है।
प्रयोग:
विस्टोर से अटैचमेंट डाउनलोड करें या सीधे अपने टर्मिनल में विस्टोर टैब से इसे राइट क्लिक करके डाउनलोड करें और इंस्टॉल करें चुनें।
इसे अपनी कंपनी VertexFX स्थानीय वीटीएल फ़ाइलें फ़ोल्डर में कॉपी करें, अर्थात C:Users”Username”AppDataRoamingVertexFX Client Terminals”Company name”VTL10Local VTL Scripts
अपने क्लाइंट टर्मिनल को पुनः आरंभ करें या स्क्रिप्ट खोजने के लिए “स्थानीय वीटीएल लिपियों” ट्री नोड पर राइट क्लिक करें।
Additional information
| Plugin-Type | Client VTL – Custom Indicator |
|---|---|
| Compatibility |

