$0.00
In stock
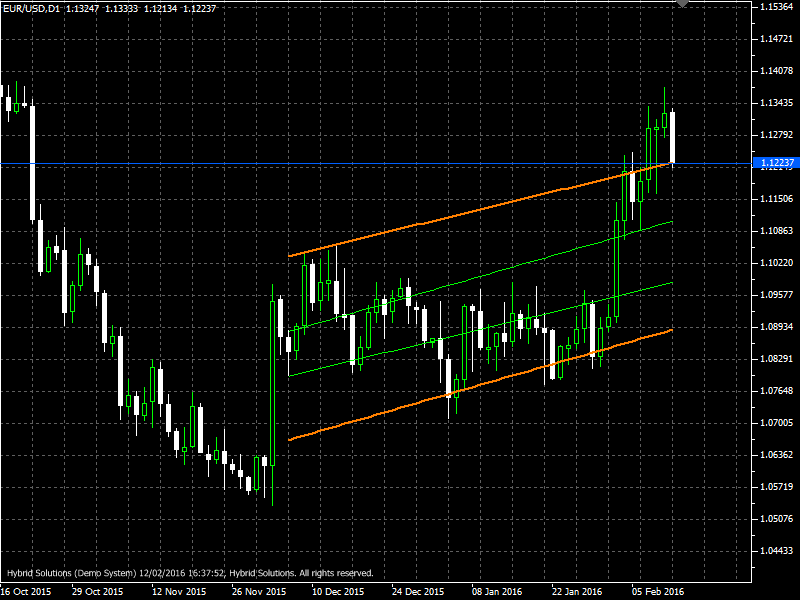
Trend Channel is a VertexFX client side VTL indicator. The indicator plots the trend channel on the basis of the method of linear regression. This channel can be viewed as a line of “equilibrium” prices, and any deflection up or down indicates increased activity of buyers or sellers.
(Downloads - 1916)

Trend Channel is a VertexFX client side VTL indicator. The indicator plots the trend channel on the basis of the method of linear regression. This channel can be viewed as a line of “equilibrium” prices, and any deflection up or down indicates increased activity of buyers or sellers.
The Linear Regression technique is a statistical methodology to determine how closely a set of points are related to each other and whether a function can define these set of points. Each point can then be expressed as y = Ax + B, where A is the Slope and B is the intercept. This concept is applied in this indicator. At first step, we calculate the regression variables over the most recent PERIOD candles. In the second step, we calculate the Slope and Intercept based on the regression variables. In the final step, the Linear Regression Line is approximated and calculated for the latest candle using the calculated Slope and Intercept.
The idea behind this technique is that in trending markets, the prices are well-organized and can be predicted with better accuracy than in sideways markets where the randomness is higher and hence predictability is lower. When the market is trending upwards or downwards, the accuracy of the Slope and Intercept is better, and hence the predicted value of the Linear Regression Line is more accurate. At the same time, the predicted Linear Regression Line follows the trend. When the trend stalls, the variation in the line increases and it is very likely that the price breaches the line. This step is repeated when a new trend is detected. Hence the Linear Regression Line provides an excellent trend-following signal with minimal lag.
Trading using Trend Channel indicator:
In an uptrend (line up the slope) it is recommended to open a buy position.
In a downtrend, it is recommended to open sell positions.
In an uptrend, place buy position when the price reaches the bottom of the orange line (target №1) or the lower green line (goal number 2). Closing of the transaction is advised when the price reaches the top of the orange line (target №1) or the upper green line (goal number 2).
In a downtrend, place sell position when the price reaches the upper green or orange line, and close the deal when the lower green or orange lines.
Usage
- Download the attachment from vStore or directly from the vStore tab in your terminal by performing a right click on it and selecting Download & Install
- Copy it to your company VertexFX Local VTL Files folder i.e. C:ProgramDataVertexFX Client Terminals”Company name”VTL10Local VTL Scripts
- Restart your Client Terminal or Right Click on “Local VTL Scripts” Tree Node to find the script.
Additional information
| Plugin-Type | Client VTL – Custom Indicator |
|---|---|
| Compatibility |

