$0.00
In stock
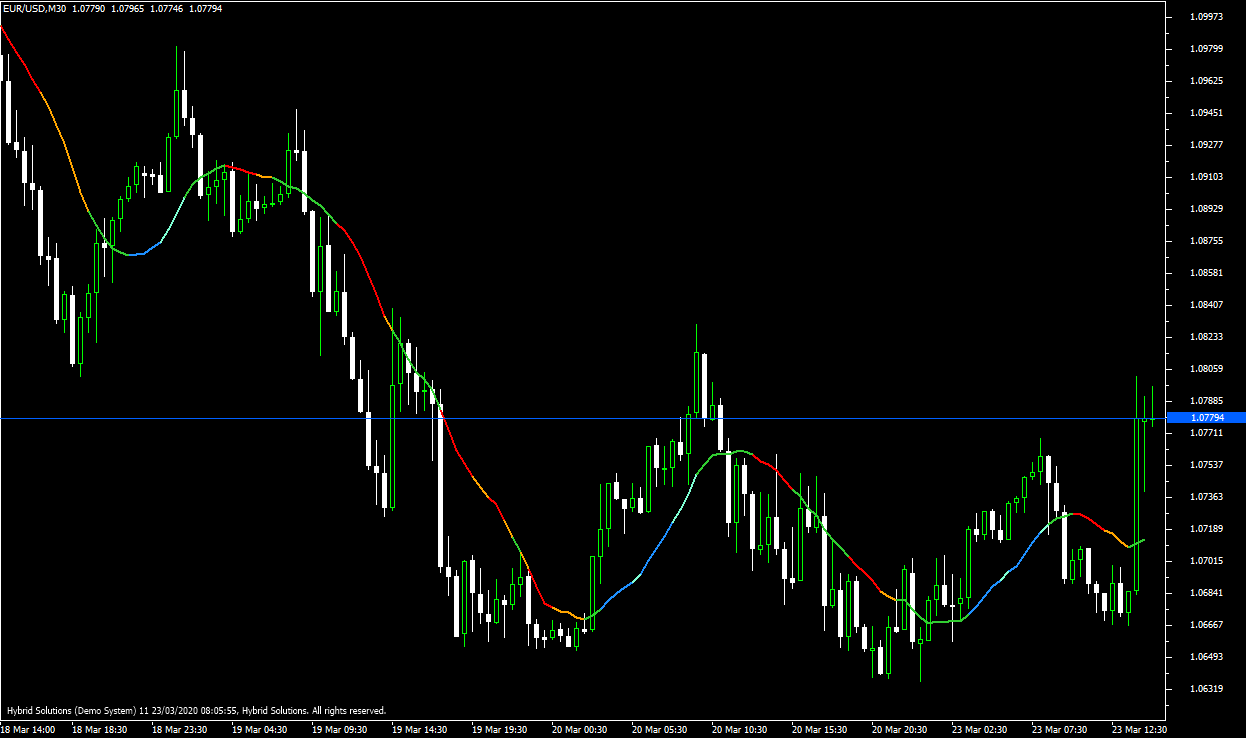
StochInMA is an innovative VertexFX indicator that identifies trend reversals and trading levels. StochInMA, as the name suggests, is a combination of the Moving Average and the Stochastic Oscilltor.
(Downloads - 940)

StochInMA is an innovative VertexFX indicator that identifies trend reversals and trading levels. StochInMA, as the name suggests, is a combination of the Moving Average and the Stochastic Oscillator.
The Moving Average by itself provides the direction of the trend and critical reversal levels. When the price is above the Moving Average the trend is considered bullish. Contrarily, when the price is below the Moving Average the trend is considered bearish. However, Moving Average by itself has a lag and results in late entries or exits. The StochInMA adds a new dimension to the Moving Average indicator by color coding the Moving Average based on the Stochastic Oscillator levels.
Traders find the Stochastic Oscillator useful in identifying trend reversals. When the Stochastic Oscillator crosses above the upper threshold it typically is a sign of bullish breakout and below the lower threshold a sign of a bearish breakout. By coloring the Moving Average based on the strength of the Stochastic Oscillator, traders get a better perspective of the strength of the trend.
One of the major advantages of the StochInMA indicator is it prevents traders from false entries and early exits.
BUY / EXIT SHORT – Enter LONG (or exit SHORT) when the StochInMA indicator turns BLUE from either GREEN or RED. The stop-loss can be set to the nearest Swing Low. Traders are advised to employ a trading stop when the trade turns profitable. Do not enter fresh LONG trades if the indicator turns BLUE from YELLOW.
SHORT / EXIT LONG – Enter SHORT (or exit LONG) when the StochInMA indicator turns RED from either GREEN or BLUE. The stop-loss can be set to the nearest Swing High. Traders are advised to employ a trading stop when the trade turns profitable. Do not enter fresh SHORT trades if the indicator turns RED from YELLOW.
Usage
- Download the attachment from vStore or directly from the vStore tab in your terminal by performing a right-click on it and selecting Download & Install
- Copy it to your company VertexFX Local VTL Files folder i.e.C:Users”Username”AppDataRoamingVertexFX Client Terminals“Company name”VTL11Local VTL Scripts
- Restart your Client Terminal or Right Click on “Local VTL Scripts” Tree Node to find the script.
Hindi Version
ICompass सिंपल मूविंग एवरेज इंडिकेटर पर आधारित एक अभिनव वर्टेक्सएफएक्स क्लाइंट-साइड इंडिकेटर है। सरल मूविंग एवरेज (एसएमए) का उपयोग करने के अलावा, यह प्रवृत्ति की ताकत निर्धारित करने के लिए एक चौरसाई सह-कुशल का उपयोग करता है। एसएमए उपयोगकर्ता को वर्तमान प्रवृत्ति के बारे में बताता है।
आमतौर पर, जब कीमत एसएमए से ऊपर होती है, तो प्रवृत्ति को तेजी माना जाता है, और जब एसएमए से नीचे होता है तो इसे मंदी माना जाता है। हालांकि, अंगूठे का ऐसा सामान्य नियम वास्तविक व्यापारिक दुनिया में उपयोगी नहीं है क्योंकि अंतराल के कारण व्यापार प्रविष्टियों में देरी होती है और बाहर निकल जाती है। इसलिए, iCompass संकेतक प्रवृत्ति की ताकत की पहचान करने के लिए हाल ही में उच्च, निम्न और औसत मूल्य का उपयोग करता है।
पहले चरण में, हाल ही में MA_PERIOD मोमबत्तियों के SMA की गणना की जाती है। फिर, हाल ही में MA_PERIOD मोमबत्तियों की सबसे ऊँची और सबसे निचली ऊँचाई की गणना की जाती है। यह हमें एक ट्रेडिंग रेंज प्रदान करता है। अगला, हम वर्तमान मंझला कीमत और ट्रेडिंग रेंज के आधार पर स्मूथिंग सह-प्रभावकारिता की गणना करते हैं। जब यह सह-कुशल कम होता है, तो इसका मतलब होता है कि मूल्य ट्रेडिंग रेंज के निचले सिरे पर है और इसलिए मंदी है। मंदी की प्रवृत्ति के लिए विपरीत है। अंत में, हम इस सह-कुशल के लॉग-सामान्य मान की गणना करते हैं, जिसका उपयोग iCompass के तेजी और मंदी की प्रवृत्ति की पहचान करने के लिए किया जाता है। जब यह मूल्य शून्य से नीचे होता है, तो इसे एक मंदी की प्रवृत्ति माना जाता है और संकेतक को लाल रंग में रंगा जाता है। इसी तरह, यदि लॉग-सामान्य सह-कुशल शून्य से ऊपर है, तो संकेतक रंगीन है BLUE एक तेजी की प्रवृत्ति को दर्शाता है। खरीदें / बाहर निकलें – जब iCompass संकेतक लाल से BLUE हो और बढ़ रहा हो तो
LONG (या बाहर निकलें) दर्ज करें। यदि संकेतक RED से BLUE हो जाता है, लेकिन LONG व्यापार में प्रवेश नहीं करता है, लेकिन फिर भी गिर रहा है। हालांकि, SHORT पदों को ऐसी शर्तों के तहत बाहर किया जा सकता है। स्टॉप-लॉस को निकटतम स्विंग कम पर सेट किया जा सकता है। व्यापारियों को सलाह दी जाती है कि जब व्यापार लाभदायक हो जाए, तो उन्हें रोक के स्थान पर नियोजित किया जाए।
SHORT / EXIT LONG – जब iCompass इंडिकेटर BLUE से लाल हो जाता है और गिर रहा होता है, तो SHORT (या बाहर निकलें) दर्ज करें। यदि संकेतक BLUE से लाल हो जाता है, लेकिन अभी भी बढ़ रहा है, तो SHORT व्यापार में प्रवेश न करें। हालांकि, ऐसी स्थितियों के तहत लंबी स्थितियों से बाहर निकाला जा सकता है। स्टॉप-लॉस को निकटतम स्विंग हाई पर सेट किया जा सकता है। व्यापारियों को सलाह दी जाती है कि जब व्यापार लाभदायक हो जाए, तो उन्हें रोक के स्थान पर नियोजित किया जाए।
प्रयोग:
विस्टोर से अटैचमेंट डाउनलोड करें या सीधे अपने टर्मिनल में विस्टोर टैब से इसे राइट क्लिक करके डाउनलोड करें और इंस्टॉल करें चुनें।
इसे अपनी कंपनी VertexFX स्थानीय वीटीएल फ़ाइलें फ़ोल्डर में कॉपी करें, अर्थात C:Users”Username”AppDataRoamingVertexFX Client Terminals”Company name”VTL11Local VTL Scripts
अपने क्लाइंट टर्मिनल को पुनः आरंभ करें या स्क्रिप्ट खोजने के लिए “स्थानीय वीटीएल लिपियों” ट्री नोड पर राइट क्लिक करें।
Additional information
| Plugin-Type | Client VTL – Custom Indicator |
|---|---|
| Compatibility |

