$0.00
In stock
sRSI (Sell Relative Strength Index) is a powerful VertexFX client-side indicator based on enhanced implementation of the Relative Strength Index (RSI) indicator.
(Downloads - 1124)

sRSI (Sell Relative Strength Index) is a powerful VertexFX client-side indicator based on enhanced implementation of the Relative Strength Index (RSI) indicator.
The RSI indicator is useful in identifying the trend of the strength as well as the end of the trend. However, one of the drawbacks of the RSI is that it introduces lag. Another drawback of RSI is that since all price changes are given equal weight the more recent price changes are not reflected quickly in the calculations. The sRSI solves this drawback by giving weight to the more recent price changes. The traditional RSI uses only Close prices. The sRSI uses Open, High, Low and Close prices to capture not only the change in trend but also the strength of the trend within the candle.
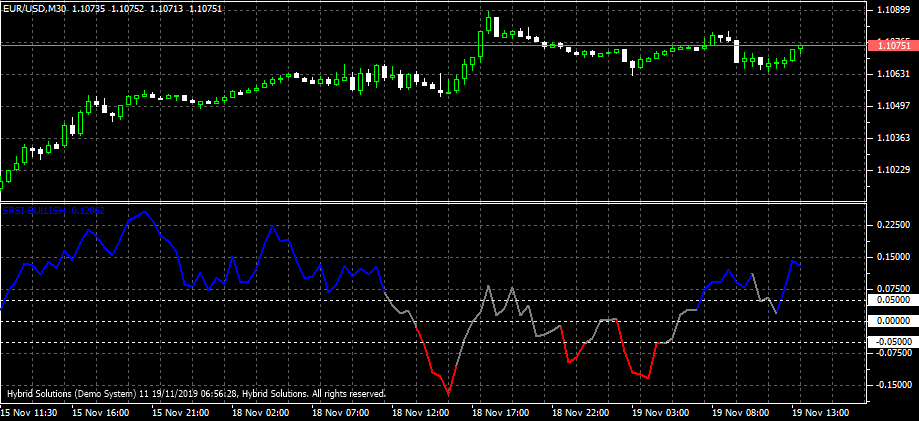
We use two levels to identify the strength of the sRSI. The primary Neutral Zone level is used to identify the sideways trend. When sRSI is inside the NEUTRAL_ZONE the trend is considered sideways. When sRSI crosses above the Neutral Zone it is considered a bullish breakout, and the trader can enter long positions in such a scenario. When the sRSI crosses below the Neutral Zone it is considered a bearish breakout, and the trader can enter short positions.
In addition to the Neutral Zone levels sRSI also provides the OverBought and Oversold Levels. When the sRSI crosses above the OverBought Level it is safe to exit the long position. Similarly, when sRSI crosses below the OverSold Level it is safe to exit the short position.
BUY / EXIT SHORT – Enter LONG (or exit SHORT) at the close of the candle when the sRSI indicator turns BLUE either from RED or GRAY. The stop-loss can be placed below the nearest Swing Low. Do not enter LONG if sRSI was BLUE before it turned GRAY and turned BLUE again. This ensures that we do not enter in sideways or whipsaw markets.
SHORT / EXIT LONG – Enter SHORT (or exit LONG) at the close of the candle when the sRSI indicator turns RED either from BLUE or GRAY. The stop-loss can be placed above the nearest Swing High. Do not enter SHORT if sRSI was RED before it turned GRAY and turned RED again. This ensures that we do not enter in sideways or whipsaw markets.
Usage
- Download the attachment from vStore or directly from the vStore tab in your terminal by performing a right-click on it and selecting Download & Install
- Copy it to your company VertexFX Local VTL Files folder i.e.C:Users”Username”AppDataRoamingVertexFX Client Terminals“Company name”VTL11Local VTL Scripts
- Restart your Client Terminal or Right Click on “Local VTL Scripts” Tree Node to find the script.
Hindi Version
SRSI (रिलेटिव स्ट्रेंथ इंडेक्स) एक शक्तिशाली वर्टेक्सएफएक्स क्लाइंट-साइड इंडिकेटर है, जो रिलेटिव स्ट्रेंथ इंडेक्स (आरएसआई) इंडिकेटर के एन्हांसमेंट पर आधारित है।
आरएसआई संकेतक ताकत की प्रवृत्ति के साथ-साथ प्रवृत्ति के अंत की पहचान करने में उपयोगी है। हालाँकि, sRSI की एक खामी यह है कि यह अंतराल का परिचय देता है। आरएसआई का एक और दोष यह है कि चूंकि सभी मूल्य परिवर्तनों को समान भार दिया जाता है, इसलिए गणना में हाल ही के मूल्य परिवर्तन जल्दी से परिलक्षित नहीं होते हैं। SRSI अधिक हालिया मूल्य परिवर्तनों को वेटेज देकर इस कमी को हल करता है। पारंपरिक आरएसआई केवल करीबी कीमतों का उपयोग करता है। SRSI ओपन, हाई, लो और क्लोज़ प्राइस का इस्तेमाल न केवल ट्रेंड में बदलाव को पकड़ने के लिए करता है बल्कि कैंडल के अंदर ट्रेंड की ताकत को भी बढ़ाता है।
हम sRSI की ताकत की पहचान करने के लिए दो स्तरों का उपयोग करते हैं। बग़ल की प्रवृत्ति की पहचान करने के लिए प्राथमिक तटस्थ ज़ोन स्तर का उपयोग किया जाता है। जब sRSI NEUTRAL_ZONE के अंदर होता है तो प्रवृत्ति को बग़ल में माना जाता है। जब एसआरएसआई न्यूट्रल ज़ोन के ऊपर से पार हो जाता है तो इसे एक तेजी से ब्रेकआउट माना जाता है, और व्यापारी इस तरह के परिदृश्य में लंबे समय तक प्रवेश कर सकता है। जब एसआरएसआई न्यूट्रल ज़ोन से नीचे जाता है, तो इसे एक ब्रेकआउट ब्रेकआउट माना जाता है, और व्यापारी छोटे पदों पर प्रवेश कर सकता है।
न्यूट्रल ज़ोन स्तरों के अलावा sRSI ओवरबॉट और ओवरसोल्ड लेवल भी प्रदान करता है। जब एसआरएसआई ओवरबॉट लेवल से ऊपर हो जाता है तो लंबी स्थिति से बाहर निकलना सुरक्षित होता है। इसी तरह, जब एसआरएसआई ओवरसोल्ड लेवल से नीचे जाता है तो शॉर्ट पोजिशन से बाहर निकलना सुरक्षित होता है।
खरीदें / बाहर निकलें – जब एसआरएसआई सूचक लाल या ग्रे से नीले रंग में बदल जाता है, तो मोमबत्ती के करीब पर (या बाहर निकलें) दर्ज करें। स्टॉप-लॉस को निकटतम स्विंग लो के नीचे रखा जा सकता है। LRA में प्रवेश न करें यदि GRAY चालू होने से पहले sRSI BLUE था और फिर से BLUE हो गया। यह सुनिश्चित करता है कि हम बग़ल में या व्हिपसॉव बाजारों में प्रवेश न करें।
SHORT / EXIT LONG – जब SRSI इंडिकेटर BLUE या GRAY से लाल हो जाता है, तो मोमबत्ती के पास SHORT (या बाहर निकलें) दर्ज करें। स्टॉप-लॉस को निकटतम स्विंग उच्च के ऊपर रखा जा सकता है। अगर GRAY चालू करने से पहले और फिर से RED हो गया तो sRSI लाल था, तो SHORT दर्ज न करें। यह सुनिश्चित करता है कि हम बग़ल में या व्हिपसॉव बाजारों में प्रवेश न करें।
प्रयोग:
विस्टोर से अटैचमेंट डाउनलोड करें या सीधे अपने टर्मिनल में विस्टोर टैब से इसे राइट क्लिक करके डाउनलोड करें और इंस्टॉल करें चुनें।
इसे अपनी कंपनी VertexFX स्थानीय वीटीएल फ़ाइलें फ़ोल्डर में कॉपी करें, अर्थात C:Users”Username”AppDataRoamingVertexFX Client Terminals”Company name”VTL10Local VTL Scripts
अपने क्लाइंट टर्मिनल को पुनः आरंभ करें या स्क्रिप्ट खोजने के लिए “स्थानीय वीटीएल लिपियों” ट्री नोड पर राइट क्लिक करें।
Additional information
| Plugin-Type | Client VTL – Custom Indicator |
|---|---|
| Compatibility |

