$0.00
In stock
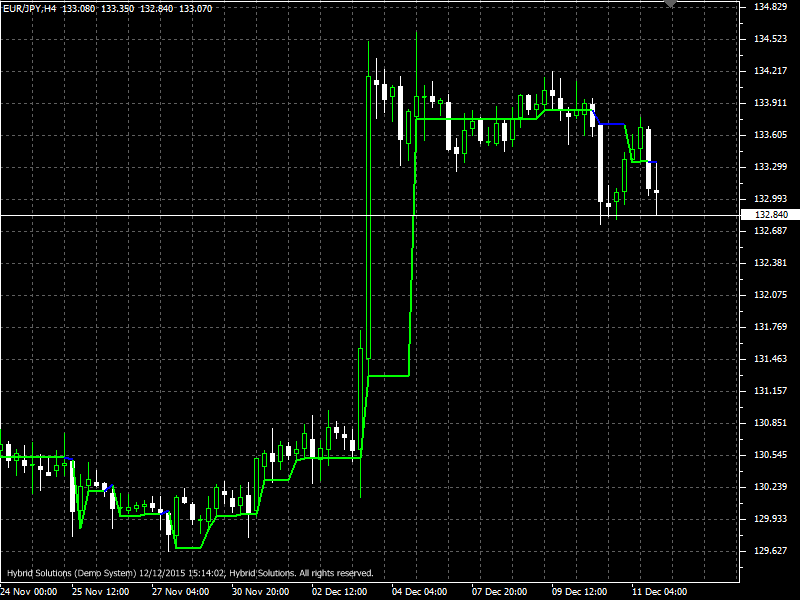
SP Trend indicator is a VertexFX client side indicator that is displays a line. The line has two colors: Green and Blue. Green color is an uptrend, and blue is a downtrend.
The green line is the level of support and the blue resistance level. You can place an order to buy when the price is closer to the support line, and place an orders to sell when the price is near the line of resistance. Closing of the transaction is advised when the price crosses the level of support or resistance level.
(Downloads - 1672)

SP Trend indicator is a VertexFX client side indicator that is displays a line. The line has two colors: Green and Blue. Green color is an uptrend, and blue is a downtrend.
The green line is the level of support and the blue resistance level. You can place an order to buy when the price is closer to the support line, and place an orders to sell when the price is near the line of resistance. Closing of the transaction is advised when the price crosses the level of support or resistance level.
Super Trend indicator shows not only the direction of the trend, but also helps discovering the Elliott wave. This indicator best applied using a trading strategy “scalping”. It perfectly shows the repositioning of prices flat. The calculation of the indicator is performed using the values of indicator Commodity Channel Index(CCI).
Usage
- Download the attachment from vStore or directly from the vStore tab in your terminal by performing a right click on it and selecting Download & Install
- Copy it to your company VertexFX Local VTL Files folder i.e. C:ProgramDataVertexFX Client Terminals”Company name”VTL10Local VTL Scripts
- Restart your Client Terminal or Right Click on “Local VTL Scripts” Tree Node to find the script.
Additional information
| Plugin-Type | Client VTL – Custom Indicator |
|---|---|
| Compatibility |

