$0.00
In stock
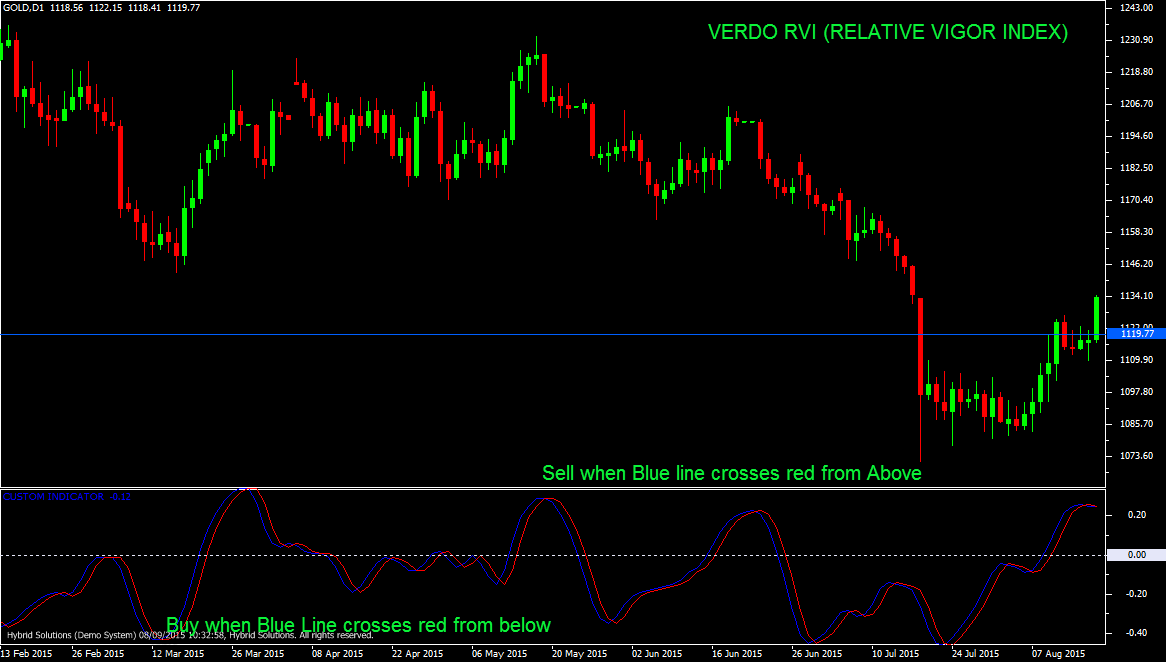
RVI (Relative Vigor Index) is a VertexFX indicator useful to detect the balance of the market, when the market deviates from this balance it can be an important turning point of the market.
(Downloads - 1430)

RVI (Relative Vigor Index) is a VertexFX indicator useful to detect the balance of the market, when the market deviates from this balance it can be an important turning point of the market.
The basic idea of RVI is that prices tend to close higher than they open in up markets and tend to close lower than they open in down Markets. The vigor of the move is thus established by where the prices reside at the end of the candle. To normalize the index to the trading range, the change in price is divided by the maximum range of prices for the candle. The RVI is an oscillator, and we are therefore only concerned with the cycle modes of the market in its use. The sharpest rate of change for a cycle is at its midpoint. Therefore, in the ascending part of the cycle we would expect the difference between the close and open to be at a maximum.
RVI consists of two components, main RVI signal (Blue) and secondary trigger (Red). The main RVI signal is calculated by dividing the numerator (Close – Open) by daily range (High – Low) and then smoothing it.
Buy – Place Buy when blue line crosses above red line. It is preferred that both red and blue lines are below zero level.
Sell – Place Sell when blue line crosses below the red line. It is preferred that both red and blue lines are above zero level.
Usage
- Download the attachment.
- Copy it to your company VertexFX Local VTL Files folder i.e. C:Program FilesCompany Namevtl10Local VTL Scripts
- Restart your Client Terminal or Right Click on “Local VTL Scripts” Tree Node to find the script.
Additional information
| Plugin-Type | Client VTL – Custom Indicator |
|---|---|
| Compatibility |

