$0.00
In stock
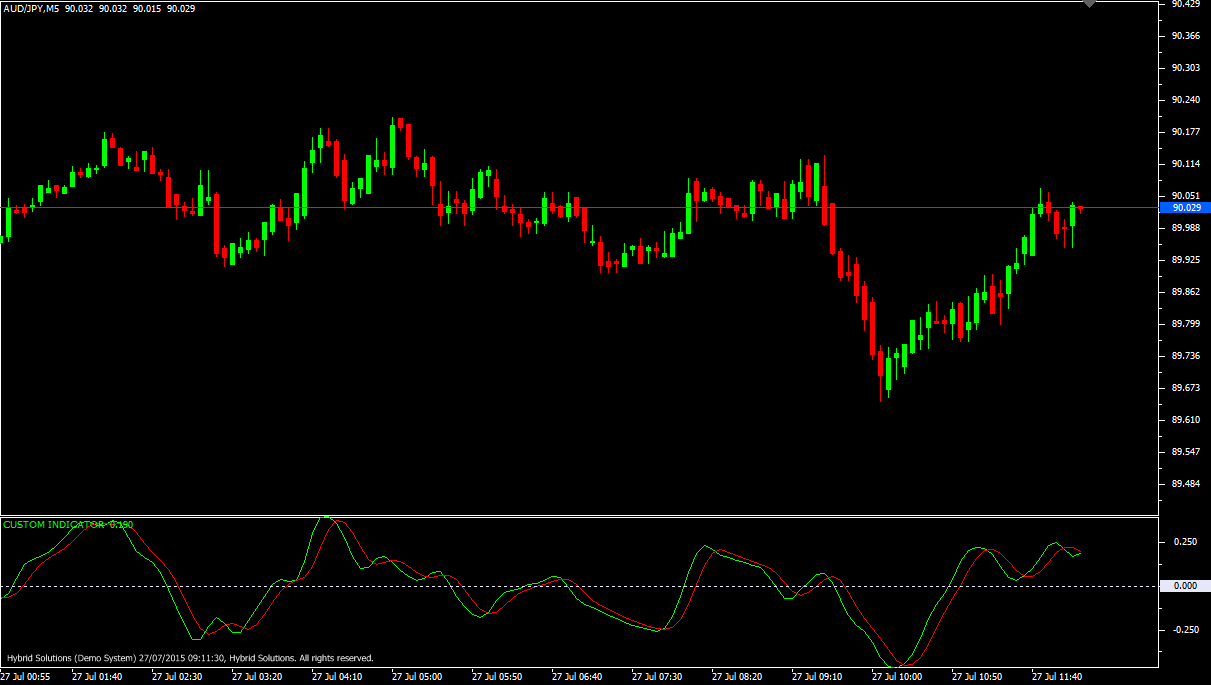
The “Relative Vigor Index”, or “RVI”, is a popular member of the “Oscillator” family of technical indicators. Its design is very similar to Stochastics except that the closing price is compared with the Open rather than the Low price for the period.
(Downloads - 1506)

The “Relative Vigor Index”, or “RVI”, is a VertexFX VTL indicator, a popular member of the “Oscillator” family of technical indicators. Its design is very similar to Stochastics except that the closing price is compared with the Open rather than the Low price for the period.
Traders generally expect the RVI to signal direction shifts and to increase in Bullish markets when momentum is on the rise and closing prices exceed opening values. Fluctuations tend to be smoother such that divergences between the index and price behavior have more meaning.
The Relative Vigor Index indicator is composed of two fluctuating curves – the “Green” line, which is the smoother RVI values, and the “Red” signal line. The Relative Vigor Index oscillator is viewed as a “leading” indicator, in that its signals foretell that a change in trend is imminent, especially when lines cross into extreme regions or when values diverge from current pricing behavior.
Usage
- Download the attachment.
- Copy it to your company VertexFX Local VTL Files folder i.e. C:Program FilesCompany Namevtl10Local VTL Scripts
- Restart your Client Terminal or Right Click on “Local VTL Scripts” Tree Node to find the script.
Additional information
| Plugin-Type | Client VTL – Custom Indicator |
|---|---|
| Compatibility |

