$0.00
In stock
RAVI-FX Fisher is a powerful VertexFX client side VTL oscillator that identifies market cycles and provides trading opportunities based on those market cycles. It is based on Average True Range (ATR) and Exponential Moving Average (EMA)indicators.
In the first step, we calculate the Average True Ranges for the fast period MA_FAST, and for the slow period, MA_SLOW. In the second step, we calculate the Exponential Moving Average for the fast period MA_FAST and for the slow period, MA_SLOW. I
(Downloads - 1700)

RAVI-FX Fisher is a powerful VertexFX client side VTL oscillator that identifies market cycles and provides trading opportunities based on those market cycles. It is based on Average True Range (ATR) and Exponential Moving Average (EMA)indicators.
In the first step, we calculate the Average True Ranges for the fast period MA_FAST, and for the slow period, MA_SLOW. In the second step, we calculate the Exponential Moving Average for the fast period MA_FAST and for the slow period, MA_SLOW. In the third step, we calculate the difference between the fast Moving Average and the slow Moving Average, and then multiply this value by the fast ATR. Finally, this value is divided by the product of the slow Moving Average and slow ATR. The concept behind this indicator is that fast MA responds quicker to change in market direction and trends. Similarly, when the markets are sideways, the ATR is lower, and as soon as the market changes direction the ATR gradually increases because the range of the market is increasing. As a result, in an up trending market, the difference between the fast EMA and slow EMA increases, and so does the ratio between the fast ATR and slow ATR. Therefore the indicator starts following the trend with a minimal lag.
When the trend stalls and saturates, the difference between the fast and slow EMA shortens, and likewise does the ratio of the fast ATR and slow ATR. The indicator now tops out and as soon as the market turns direction it starts moving in the opposite direction.
|
BUY :
|
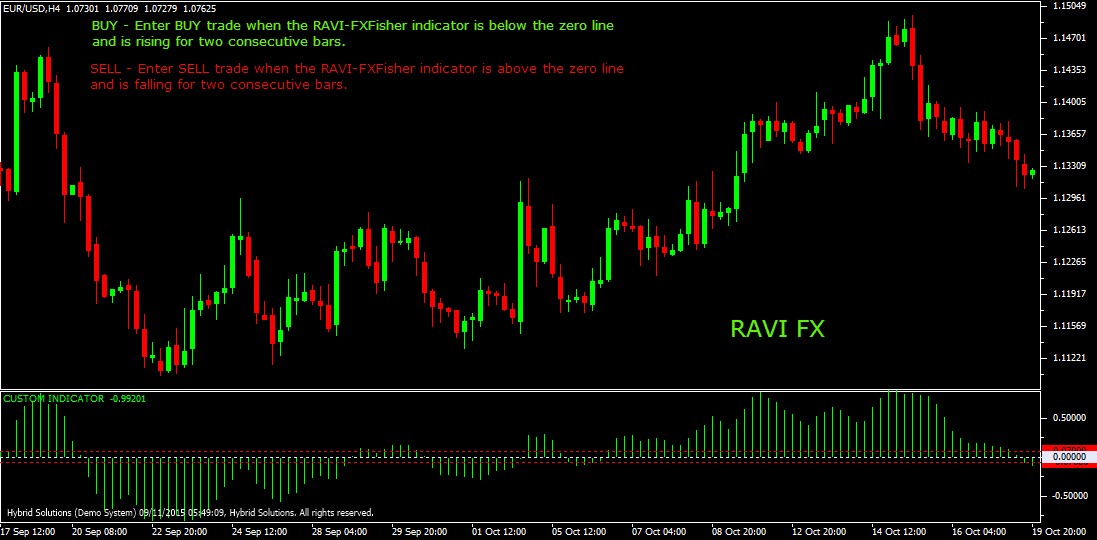
Place Buy position when RAVI-FX Fisher indicator is below the zero line and is rising for two consecutive bars.
|
|---|---|
|
SELL :
|
Place Sell postion when RAVI-FX Fisher indicator is above the zero line and is falling for two consecutive bars.
|
Usage
- Download the attachment from vStore or directly from the vStore tab in your terminal by performing a right click on it and selecting Download & Install
- Copy it to your company VertexFX Local VTL Files folder i.e. C:Program FilesCompany Namevtl10Local VTL Files
- Restart your Client Terminal or Right Click on “Local VTL Scripts” Tree Node to find the Script.
Additional information
| Plugin-Type | Client VTL – Custom Indicator |
|---|---|
| Compatibility |

