$0.00
In stock
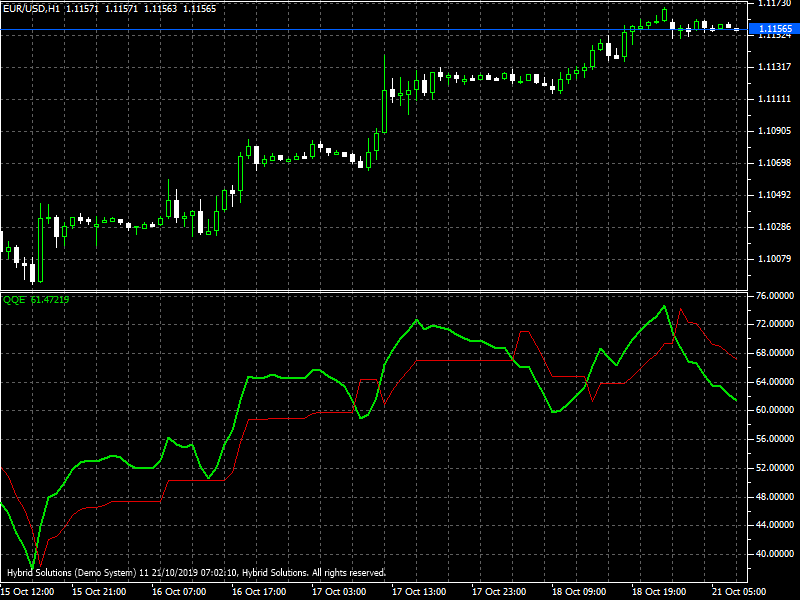
Qualitative Quantitative Estimation (QQE) VertexFX indicator is based on a combination of smoothed Moving Average of RSI along with the average true range ATR.
(Downloads - 1172)

Qualitative Quantitative Estimation (QQE) VertexFX indicator is based on a combination of smoothed Moving Average of RSI along with the average true range ATR. Volatile assets such as Forex, futures, stocks, etc. can be monitored using the Qualitative Quantitative Estimation (QQE) indicator.
The indicator displays two lines; a fast and a slow-moving trailing stop line. Level 50 is important in the QQE indicator. When the fast line (green line) is above 50, the trend is considered bullish, if it is below 50, a downtrend is assumed.
The original QQE indicator trading strategy is to buy when the green line is above 50 and it crosses above the red line. For a sell trade, the green line is below 50 and the green line cross below the red line.
Some traders open Buy position when the green line is below 50 and it crosses above the red line. Another method is a divergence between price and QQE indicator. When price makes new lows and QQE indicator’s green line fails to make new lows buy position can be opened. When price makes New highs and QQE green line fails to make new highs sell position can be opened.
Usage
- Download the attachment from vStore or directly from the vStore tab in your terminal by performing a right-click on it and selecting Download & Install
- Copy it to your company VertexFX Local VTL Files folder i.e.C:Users”Username”AppDataRoamingVertexFX Client Terminals“Company name”VTL11Local VTL Scripts
- Restart your Client Terminal or Right Click on “Local VTL Scripts” Tree Node to find the script.
Hindi Version
Qualitative Quantitative Estimation (QQE) आरएसआई के स्मूथेड मूविंग एवरेज के संयोजन के साथ-साथ औसत सच रेंज आरटीआर पर आधारित है। गुणात्मक मात्रात्मक अनुमान (QQE) सूचक का उपयोग करके विदेशी मुद्रा, वायदा, स्टॉक आदि जैसे अस्थिर परिसंपत्तियों की निगरानी की जा सकती है। सूचक दो लाइनें प्रदर्शित करता है; एक तेज और धीमी गति से चलती ट्रेलिंग स्टॉप लाइन। QQE संकेतक में स्तर 50 महत्वपूर्ण है। जब फास्ट लाइन (ग्रीन लाइन) 50 से ऊपर होती है, तो प्रवृत्ति को तेजी माना जाता है, अगर यह 50 से नीचे है, तो डाउनट्रेंड मान लिया गया है।
मूल QQE संकेतक ट्रेडिंग रणनीति खरीदना है जब हरी रेखा 50 से ऊपर है और यह बिंदीदार लाल रेखा से ऊपर है। एक सेल ट्रेड के लिए ग्रीन लाइन 50 से नीचे है और डॉटेड रेड लाइन नीचे ग्रीन लाइन क्रॉस है।
कुछ व्यापारी ओपन पोजीशन तब खरीदते हैं जब ग्रीन लाइन 50 से नीचे होती है और यह रेड लाइन के ऊपर होती है। एक अन्य विधि मूल्य और QQE संकेतक के बीच विचलन है। जब कीमत नए चढ़ाव बनाती है और QQE संकेतक की हरी रेखा नई चढ़ाव बनाने में विफल रहती है, तो खरीद स्थिति को खोला जा सकता है। जब कीमत नई ऊंचाई बनाती है और क्यूक्यूई ग्रीन लाइन नई ऊंचाई बनाने में विफल रहती है, तो बेचने की स्थिति खोली जा सकती है।
प्रयोग:
विस्टोर से अटैचमेंट डाउनलोड करें या सीधे अपने टर्मिनल में विस्टोर टैब से इसे राइट क्लिक करके डाउनलोड करें और इंस्टॉल करें चुनें।
इसे अपनी कंपनी VertexFX स्थानीय वीटीएल फ़ाइलें फ़ोल्डर में कॉपी करें, अर्थात C:Users”Username”AppDataRoamingVertexFX Client Terminals”Company name”VTL10Local VTL Scripts
अपने क्लाइंट टर्मिनल को पुनः आरंभ करें या स्क्रिप्ट खोजने के लिए “स्थानीय वीटीएल लिपियों” ट्री नोड पर राइट क्लिक करें।
Additional information
| Plugin-Type | Client VTL – Custom Indicator |
|---|---|
| Compatibility |

