$0.00
In stock
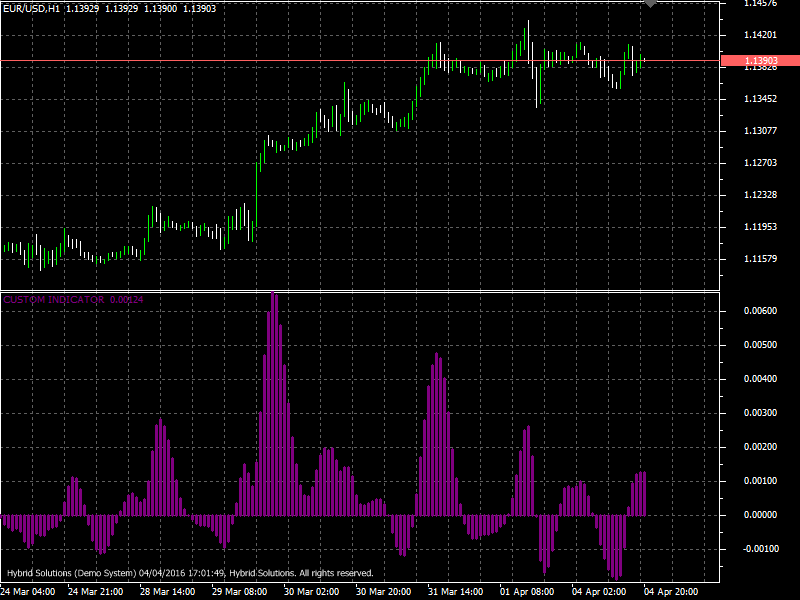
OsHMA indicator (Hull Moving average of oscillator) – is a VertexFX client side VTL indicator that determines the start of new trends. The hull moving average of oscillator measures and plots the difference between the oscillator and the oscillator’s smoothing. When divergence appears between OsHMA and the price, it indicates a high probability that the current trend will finish soon.
(Downloads - 1873)

OsHMA indicator (Hull Moving average of oscillator) – is a VertexFX client side VTL indicator that determines the start of new trends. The hull moving average of oscillator measures and plots the difference between the oscillator and the oscillator’s smoothing. When divergence appears between OsHMA and the price, it indicates a high probability that the current trend will finish soon.
The discrepancy of the price and OsHMA indicator is a trustworthy signal. The OsHMA is not to be confused for moving average oscillator which works in a different set of principles and is calculated differently. The OsHMA indicator determines the relationship between trend and the price, signaling overbought or oversold conditions in the market.
OsHMA indicator has some distinctive signal triggers. When the OsHMA switches from declining to rising histogram, it alerts traders to a rising bullish trend and similarly when the OsHMA switches from rising to declining histogram, it indicates a change to a bearish trend.
The formula for calculating OsHMA: OsHMA = MACD – SIGNAL (difference between the two values). MACD = HMAs (P, N) – HMAs (P, N), SIGNAL = SMA (MACD, N), where:
HMAf – fast hull moving average (short term);
HMAs – slow hull moving average (long term);
SMA – simple moving average (signal line);
SIGNAL – smoothing the simple moving average;
N – number of periods taken for the calculation;
P – price (Close, Open, High, Low, Typical Price, Median Price).
How to Use OsHMa Indicator Extremum points:
– OsHMA switching from falling to rising in extreme areas may be a sign of bullish reversal;
– OsHMA switching from rising to falling may be a sign of bearish reversal.
Crossing zero axis:
– OsHMA rising above zero (corresponds to MACD crossing from below its signal line) generates a buy signal;
– OsHMA falling below zero (corresponds to MACD crossing from above its signal line) generates a sell signal.
Usage
- Download the attachment from vStore or directly from the vStore tab in your terminal by performing a right click on it and selecting Download & Install
- Copy it to your company VertexFX Local VTL Files folder i.e. C:ProgramDataVertexFX Client Terminals”Company name”VTL10Local VTL Scripts
- Restart your Client Terminal or Right Click on “Local VTL Scripts” Tree Node to find the script.
Russian Version:
Осциллятор OsHMA – индикатор торговой платформы VertexFX . OsHMA показывает нам расстояние между MACD и его сигнальной линией.
Аббревиатура OsНma расшифровывается, как Hull Moving average of oscillator. Если установить индикатор oshma на ценовой график, то он будет отображаться в виде гистограммы, столбики которой, в зависимости от динамики рынка, меняют свой размер. Гистограмма по мере движения цены может пересекать нулевой барьер, что будет указывать нам на силу покупателей или продавцов.
Сигналы индикатора OsНMA, построены по принципу пересечения нулевого уровня гистограммой и ее возрастании, или уменьшении в зависимости от движения цены. Сигнал на покупку происходит при пробое нулевого уровня снизу вверх и постепенном увеличении линий гистограммы, сигналом на продажу служат противоположные условия, пробой нулевого уровня сверху вниз.
Формула расчета индикатора:
OsMA = MACD – SIGNAL (разница двух значений).
MACD = EMAf (P, N)- EMAs (P, N),
SIGNAL = SMA(MACD, N),
где: EMAf – быстрое экспоненциальное скользящее среднее (с коротким сроком);
EMAs – медленное экспоненциальное скользящее среднее (с длинным сроком);
SMA – простое скользящее среднее (сигнальня линия);
SIGNAL – сглаживающая простой скользящей средней;
N – число сроков принимаемое для расчета;
P – показатель цены текущего срока (Close, Open, High, Low, Typical Price, Median Price).
Данный индикатор применятся для сглаживания значений такого осциллятора как «MACD», что позволяет уменьшить количество неверных сигналов. Торговый инструмент был разработан в качестве сигнального, поэтому для более эффективной организации сигналов к продаже и покупке, на график инструмента добавляется сигнальная и девятипериодная линия «MACD». «OSMA» подходит для торговли на валютном рынке при высокой амплитуде колебаний цены.
Загрузите прикрепленный файл с сайта vStore.co или с панели vStore вашего терминала нажав правую кнопку мышки и выбрав Download & Install (Загрузить и установить).
Скопируйте вложение в директорию с установленным терминалом по следующему пути: C:ProgramDataVertexFX Client Terminals”Company name”VTL10Local VTL Scripts.
Перезагрузите VertexFX терминал или нажмите правой кнопкой мыши на “Локальные VTL – скрипты” а затем выберете пункт меню обновить. После этого, вы можете увидеть скрипт в перечне скриптов.
Additional information
| Plugin-Type | Client VTL – Custom Indicator |
|---|---|
| Compatibility |


Reviews
There are no reviews yet.