$0.00
In stock
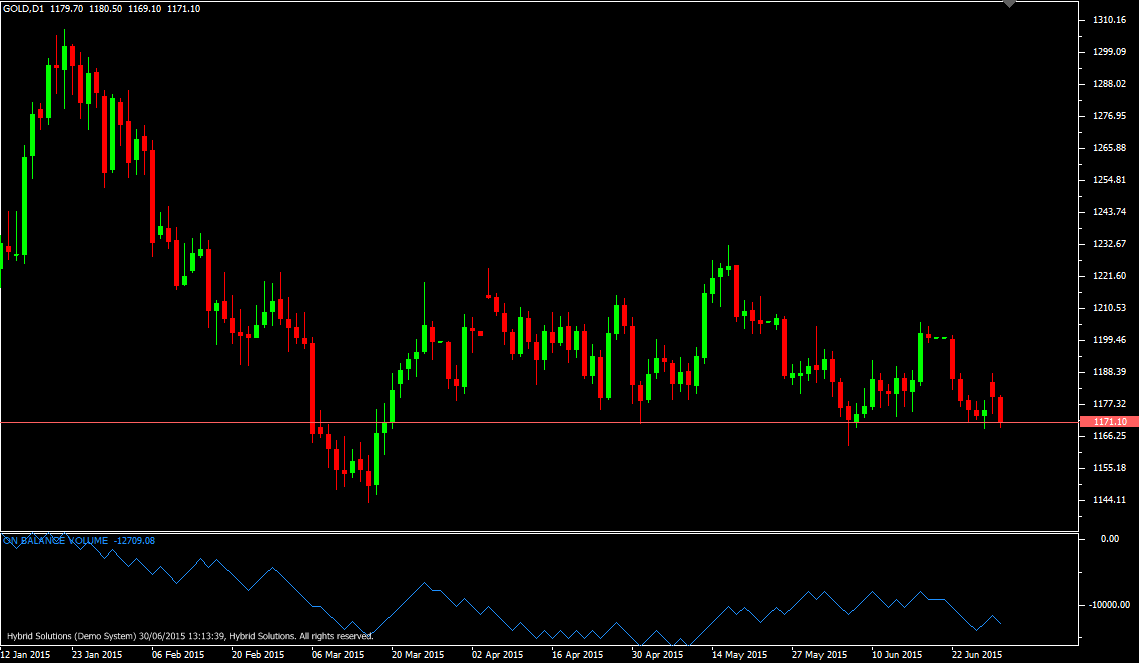
On Balance Volume Technical Indicator (OBV) is a client side VTL Script , that relates volume to price change. The indicator, which Joseph Granville came up with, is pretty simple.
(Downloads - 1550)

On Balance Volume Technical Indicator (OBV) is a client side VTL Script , that relates volume to price change. The indicator, which Joseph Granville came up with, is pretty simple.
When the security closes higher than the previous close, all of the day’s volume is considered up-volume. When the security closes lower than the previous close, all of the day’s volume is considered down-volume. The basic assumption, regarding On Balance Volume analysis, is that OBV changes precede price changes. The theory is that smart money can be seen flowing into the security by a rising OBV. When the public then moves into the security, both the security and the On Balance Volume will surge ahead. If the security’s price movement precedes OBV movement, a “non-confirmation” has occurred. Non-confirmations can occur at bull market tops (when the security rises without, or before, the OBV) or at bear market bottoms (when the security falls without, or before, the On Balance Volume Technical Indicator).
The OBV is in a rising trend when each new peak is higher than the previous peak and each new trough is higher than the previous trough. Likewise, the On Balance Volume is in a falling trend when each successive peak is lower than the previous peak and each successive trough is lower than the previous trough. When the OBV is moving sideways and is not making successive highs and lows, it is in a doubtful trend. Once a trend is established, it remains in force until it is broken. There are two ways in which the On Balance Volume trend can be broken. The first occurs when the trend changes from a rising trend to a falling trend, or from a falling trend to a rising trend.
Calculation If today’s close is greater than yesterday’s close then:
OBV(i) = OBV(i-1)+VOLUME(i) If today’s close is less than yesterday’s close then: OBV(i) = OBV(i-1)-VOLUME(i) If today’s close is equal to yesterday’s close then: OBV(i) = OBV(i-1)
where:
- OBV(i) — is the indicator value of the current period;
- OBV(i-1) — is the indicator value of the previous period;
- VOLUME(i) — is the volume of the current bar.
Usage
- Download the attachment.
- Copy it to your company VertexFX Local VTL Files folder i.e. C:Program FilesCompany Namevtl10Local VTL Scripts
- Restart your Client Terminal or Right Click on “Local VTL Scripts” Tree Node to find the script.
Additional information
| Plugin-Type | Client VTL – Alert |
|---|---|
| Compatibility |

