$0.00
In stock
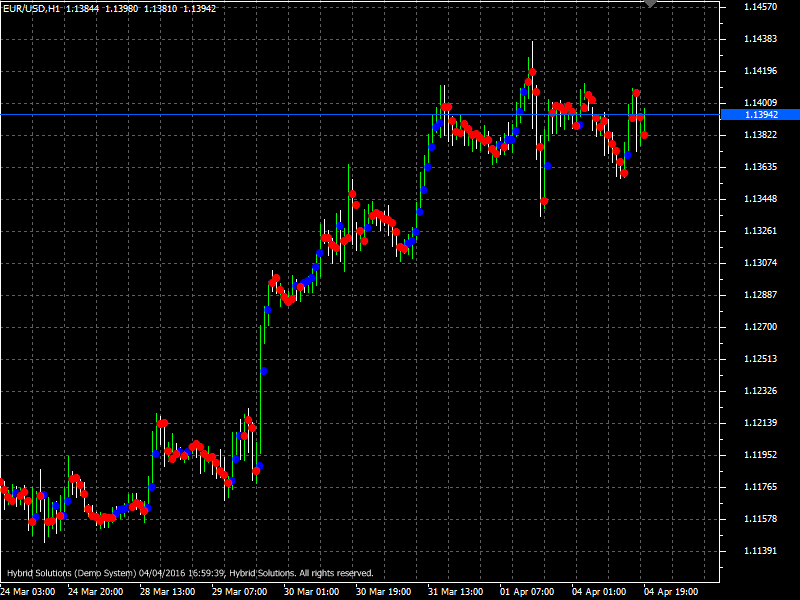
NonLagDot is a VertexFX client side VTL indicator which gives an interpretation of market trends. Nonlagdot is the supply and demand indicator that calculates a possible trend considering market forces domination.
(Downloads - 1740)

NonLagDot is a VertexFX client side VTL indicator which gives an interpretation of market trends. Nonlagdot is the supply and demand indicator that calculates a possible trend considering market forces domination.
Notation of trends is conducted in accordance with dominant market forces. If the bulls (buyers) are dominant, it will be marked with blue dots on a chart. In the case of dominance of the bears (sellers) on the schedule this will be indicated by red dots.
Method of calculation and construction of the indicator: First we define alpha coefficient that is equal to alfa=1.0/(3*pi*(2*Cycle-1)/(Cycle*Length-1)+1) * MathCos(pi*(2*Cycle-1)/(Cycle*Length-1)). Next, we define a weighted average price of the alpha coefficient over the period equal to the input parameter Length, Buffer(shift)=(1.0+Deviation/100)*Sum+alfa*price(i)/Sum+alfa*price(i). After that we determine whish of trend is present on the market now. This we define the following condition: If the difference between the current and the previous value of Buffer() more than current price that means the market has an upward trend, and the color of the points displayed on the chart will be blue, and vice versa.
The main parameters of the indicator:
Length(default = 10) – period, that is, the number of bars used to calculate prices. The period is longer, the signal more accurately, but that it is more delayed. And vice versa.
Filter(default = 0) – minor degree of filtering signals. At higher values of this parameter will be the transformation of a smooth moving average indicator in the broken line, a cut-off short-term trends.
Buy – Place Buy psotion at close of candle when the indicator is Blue. Do not open buy trade if the candle has a gap up opening. Place stop-loss below the nearest swing low.
Sell – Place Sell postion at close of candle when the indicator is Red. Do not open sell trade if the candle has a gap down opening. Place stop-loss above the nearest swing high.
Usage
- Download the attachment from vStore or directly from the vStore tab in your terminal by performing a right click on it and selecting Download & Install
- Copy it to your company VertexFX Local VTL Files folder i.e. C:ProgramDataVertexFX Client Terminals”Company name”VTL10Local VTL Scripts
- Restart your Client Terminal or Right Click on “Local VTL Scripts” Tree Node to find the script.
Additional information
| Plugin-Type | Client VTL – Custom Indicator |
|---|---|
| Compatibility |

