$0.00
In stock
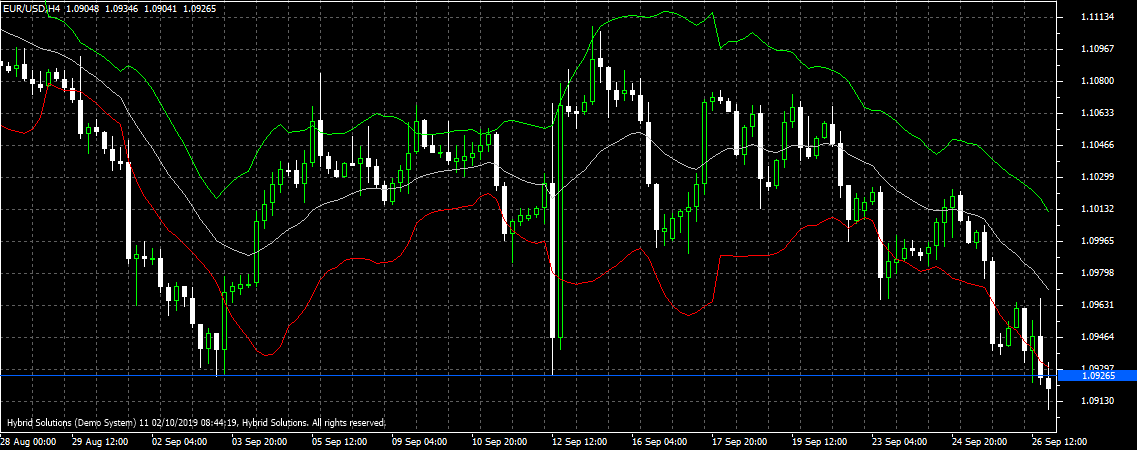
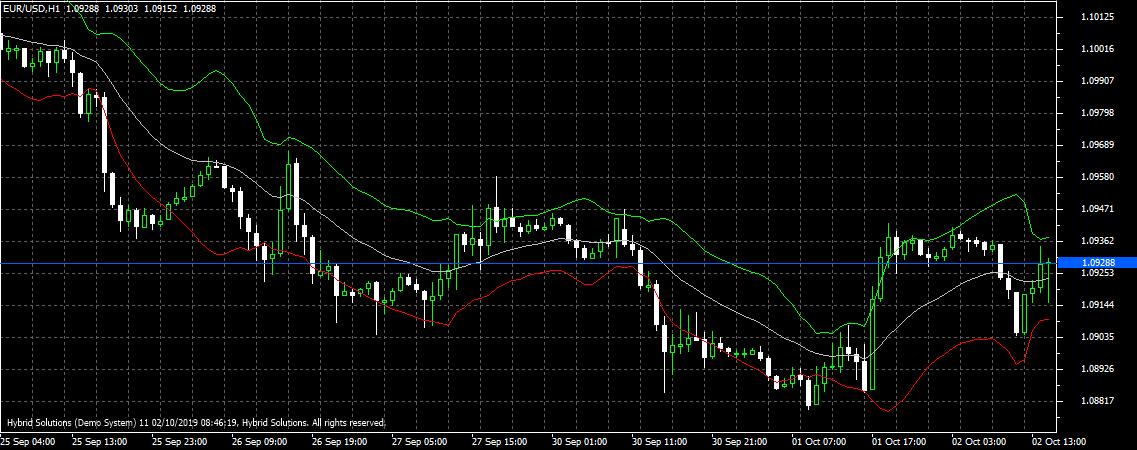
Kirshenbaum Bands is a powerful VertexFX indicator that attempts to reduce the lag and enhance the accuracy of the Bollinger Bands. It is an improvement over the Bollinger Bands and is used primarily to identify trend reversals.
(Downloads - 1051)

Kirshenbaum Bands is a powerful VertexFX indicator that attempts to reduce the lag and enhance the accuracy of the Bollinger Bands. It is an improvement over the Bollinger Bands and is used primarily to identify trend reversals.
One of the main disadvantages of the Bollinger Bands is that it has lagged and is slow to respond to trend reversals. The standard deviation is calculated in a linear fashion – the recent price movements have the same weight as older price movements. As a result, it is slow to respond to the recent price movements. The Kirshenbaum Bands overcomes this issue and giving a higher weight to the recent price movements. Likewise, if uses Exponential Moving Average (EMA) as compared to the Simple Moving Average (SMA) of the Bollinger Bands. Since higher weight is given to recent price movements, Kirshenbaum Bands responds to trend reversals quickly.
Calculation:
In the first step, we calculate the moving average of the specified price field (BAND_PRICE) over the recent candles (BAND_PERIOD) based on the moving average method (BAND_METHOD). By default we use Exponential Moving Average as it yields better performance.
In the second step, we calculate the standard deviation. However, instead of using equal weight, the recent candles are assigned higher weight. So, if the BAND_PERIOD is set to 21, then the recent error-mean is multiplied by 21, the previous one by 20 and so on. Finally, we calculate the standard deviation.
The upper band is calculated by multiplying the standard deviation with its multiplier and adding it to the moving average. Similarly, the lower band is calculated by multiplying the standard deviation with its multiplier and subtracting it from the moving average.
Compared to the Bollinger Bands, it has greater response to price movements and can identify reversals
BUY / EXIT SHORT – Enter LONG (or exit SHORT) at the close of the candle when the price closes above the lower Kirshenbaum Band (RED) from below. The stop-loss can be set to the nearest Swing Low.
SHORT / EXIT LONG – Enter SHORT (or exit LONG) at the close of the candle when the price closes below the upper Kirshenbaum Band (GREEN) from above. The stop-loss can be set to the nearest Swing Low.
Usage
- Download the attachment from vStore or directly from the vStore tab in your terminal by performing a right-click on it and selecting Download & Install
- Copy it to your company VertexFX Local VTL Files folder i.e.C:Users”Username”AppDataRoamingVertexFX Client Terminals“Company name”VTL11Local VTL Scripts
- Restart your Client Terminal or Right Click on “Local VTL Scripts” Tree Node to find the script.
Hindi Version:

Kirshenbaum बैंड एक शक्तिशाली वर्टेक्सफ़एक्स क्लाइंट-साइड इंडिकेटर है जो लैग को कम करने और बोलिंगर बैंड की सटीकता को बढ़ाने का प्रयास करता है। यह बोलिंगर बैंड पर एक सुधार है और इसका उपयोग मुख्य रूप से ट्रेंड रिवर्सल की पहचान करने के लिए किया जाता है।
बोलिंगर बैंड के मुख्य नुकसानों में से एक यह है कि इसमें अंतराल है और ट्रेंड रिवर्सल के जवाब में धीमा है। मानक विचलन की गणना एक रैखिक फैशन में की जाती है – हाल ही में मूल्य आंदोलनों में पुराने मूल्य आंदोलनों के समान भार होता है। नतीजतन, हाल के मूल्य आंदोलनों का जवाब देना धीमा है। Kirshenbaum Bands इस मुद्दे पर काबू पाती है और हालिया मूल्य आंदोलनों के लिए एक उच्च भार प्रदान करती है। इसी तरह, यदि बोलिंगर बैंड के सरल मूविंग एवरेज (एसएमए) की तुलना में घातीय मूविंग एवरेज (ईएमए) का उपयोग किया जाता है। चूँकि हाल के मूल्य आंदोलनों के लिए उच्च भार दिया गया है, किरशेनबाम बैंड्स ने तेजी से उलटफेर करने के लिए प्रतिक्रिया दी।
पहले चरण में, हम चलती औसत विधि (BAND_METHOD) के आधार पर हाल की मोमबत्तियों (BAND_PERIOD) पर निर्दिष्ट मूल्य क्षेत्र (BAND_PRICE) के मूविंग औसत की गणना करते हैं। डिफ़ॉल्ट रूप से हम घातीय मूविंग एवरेज का उपयोग करते हैं क्योंकि यह बेहतर प्रदर्शन देता है।
दूसरे चरण में, हम मानक विचलन की गणना करते हैं। हालांकि, समान वेटेज का उपयोग करने के बजाय, हाल की मोमबत्तियों को उच्च वेटेज सौंपा गया है। तो, अगर BAND_PERIOD को 21 पर सेट किया जाता है, तो हाल के त्रुटि-माध्य को 21 से गुणा किया जाता है, पिछले 20 से और इसी तरह। अंत में, हम मानक विचलन की गणना करते हैं।
ऊपरी बैंड की गणना उसके गुणक के साथ मानक विचलन को गुणा करके और चलती औसत में जोड़कर की जाती है। इसी प्रकार, निचले बैंड की गणना उसके गुणक के साथ मानक विचलन को गुणा करके और चलती औसत से घटाकर की जाती है।
बोलिंगर बैंड की तुलना में, इसकी कीमत आंदोलनों के लिए अधिक प्रतिक्रिया है और यह पलटवाँ की पहचान कर सकता है
खरीदें / बाहर निकलें – नीचे से किरशेंबाम बैंड (RED) के ऊपर कीमत बंद होने पर मोमबत्ती के पास में LONG (या SHORT) से बाहर निकलें। स्टॉप-लॉस निकटतम स्विंग कम पर सेट किया जा सकता है।
SHORT / EXIT LONG – ऊपर से किरशेनबाम बैंड (GREEN) से नीचे की कीमत बंद होने पर मोमबत्ती के करीब पर SHORT (या बाहर निकलें) दर्ज करें। स्टॉप-लॉस निकटतम स्विंग कम पर सेट किया जा सकता है।
प्रयोग:
विस्टोर से अटैचमेंट डाउनलोड करें या सीधे अपने टर्मिनल में विस्टोर टैब से इसे राइट क्लिक करके डाउनलोड करें और इंस्टॉल करें चुनें।
इसे अपनी कंपनी VertexFX स्थानीय वीटीएल फ़ाइलें फ़ोल्डर में कॉपी करें, अर्थात C:Users”Username”AppDataRoamingVertexFX Client Terminals”Company name”VTL10Local VTL Scripts
अपने क्लाइंट टर्मिनल को पुनः आरंभ करें या स्क्रिप्ट खोजने के लिए “स्थानीय वीटीएल लिपियों” ट्री नोड पर राइट क्लिक करें।
Additional information
| Plugin-Type | Client VTL – Custom Indicator |
|---|---|
| Compatibility |

