$0.00
In stock
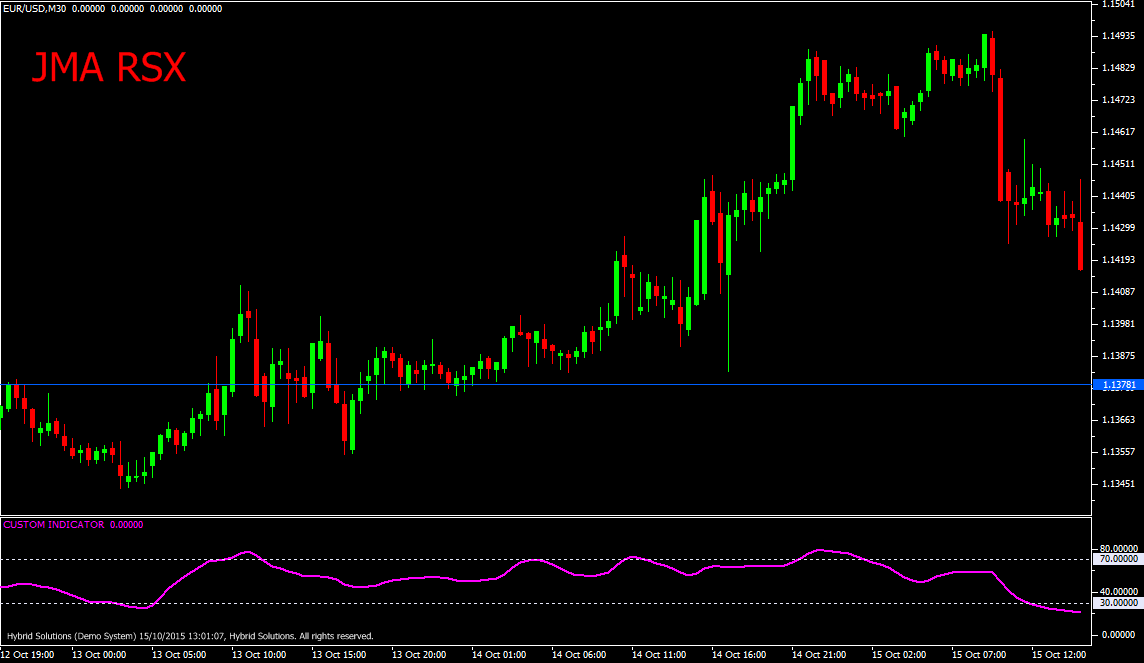
JMA RSX indicator is a comparative VertexFX client side VTL indicator based upon the Jurik Moving Average methodology of calculating the RSX. It is useful in determining cyclical market trends, especially turning points where the market changes direction.
At first step, smoothed price of the close price over PERIOD is calculated over the PERIOD bars using the Jurik Moving Average method. The minimum PERIOD is 5 bars. This smoothed price is then differentiated against the value PERIOD bars ago to determine the rate of change in price movements.
(Downloads - 1551)

JMA RSX indicator is a comparative VertexFX client side VTL indicator based upon the Jurik Moving Average methodology of calculating the RSX. It is useful in determining cyclical market trends, especially turning points where the market changes direction.
At first step, smoothed price of the close price over PERIOD is calculated over the PERIOD bars using the Jurik Moving Average method. The minimum PERIOD is 5 bars. This smoothed price is then differentiated against the value PERIOD bars ago to determine the rate of change in price movements.
The advantage of this is that sideways movements are eliminated from the smoothed price. Finally, this difference is expressed as relative strength and multiplied by 100 to calculate the JMA RSX. As a result, it provides an indicator which is flatter and smoother than RSI, but which responds faster to market turning points. JMA RSX is an oscillator with the range between 0 and 100. It follows the market direction with minimal lag, and smoothing employed eliminates whipsaws and sideways movements. Falling values of JMA RSX indicates bearishness and on the contrary rising values of JMA RSX imply bullishness. When the JMA RSX reverses its direction from below 30 level, the market has saturated at the bottom and the probability of an upwards trend is very high. Likewise, when the JMA RSX reverses its direction from above 70 level, it implies that the market has topped out and the probability of a down trend is very high.
BUY – Place Buy position when the JMA RSX indicator has closed above 30 from below.
Sell – Place Sell position when the JMA RSX indicator has closed below 70 from below.
Usage
- Download the attachment from vStore or directly from the vStore tab in your terminal by performing a right click on it and selecting Download & Install
- Copy it to your company VertexFX Local VTL Files folder i.e. C:Program FilesCompany Namevtl10Local VTL Files
- Restart your Client Terminal or Right Click on “Local VTL Scripts” Tree Node to find the script.
Additional information
| Plugin-Type | Client VTL – Custom Indicator |
|---|---|
| Compatibility |

