$0.00
In stock
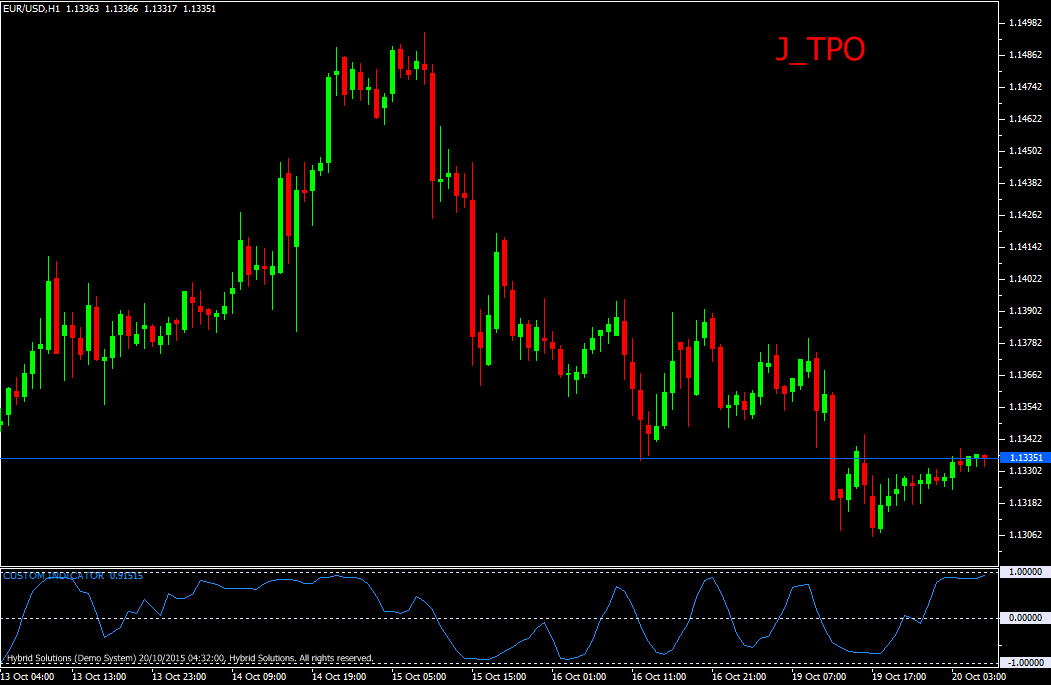
J_TPO indicator is a VertexFX client side VTL oscillator where the calculation is based on the rate of change in price over the LENGTH bars, and is smoothed for elimination of lag.
At first step, we calculate the rate of change based on the current price and the price LENGTH bars ago. In next step, this rate of change is smoothed using polynomial co-efficient (polynomial squares fit). By doing this J_TPO indicator attempts to predict the rate of change for the next bar. Finally, one more level of smoothing is applied to generate the J_TPO oscillator. It oscillates between -1 and +1.
(Downloads - 1551)

J_TPO indicator is a VertexFX client side VTL oscillator where the calculation is based on the rate of change in price over the LENGTH bars, and is smoothed for elimination of lag.
At first step, we calculate the rate of change based on the current price and the price LENGTH bars ago. In next step, this rate of change is smoothed using polynomial co-efficient (polynomial squares fit). By doing this J_TPO indicator attempts to predict the rate of change for the next bar. Finally, one more level of smoothing is applied to generate the J_TPO oscillator. It oscillates between -1 and +1.
Falling values, or values below 0 imply bearishness, and rising values, and values above 0 imply bullishness. The polynomial squares fit method is used to find a polynomial equation that finds a curve which is closest to all points over the recent LENGTH period. Based on this polynomial equation, we find the projected price at the current point. The distance between the current closing price and the equation point is the accuracy of the indicator.
The concept behind J_TPO indicator is that when the prices are trending, the accuracy of the predicated value is very high, and hence the indicator moves in the direction trend. When prices are not moving in a trend, either sideways or stationary, then accuracy of the predicated value is low because we do not know in what direction the next candle will be. In this case the indicator gives a sideways value, or runs into saturation.
Usage – This indicator must be used as reference along with other trading indicators.
Buy Advice – Avoid Buy trades if J_TPO indicator value is below 0, or is falling.
Sell – Advice – Avoid Sell trades if J_TPO indicator value is above 0, or is rising.
Usage
- Download the attachment from vStore or directly from the vStore tab in your terminal by performing a right click on it and selecting Download & Install
- Copy it to your company VertexFX Local VTL Files folder i.e. C:Program FilesCompany Namevtl10Local VTL Files
- Restart your Client Terminal or Right Click on “Local VTL Scripts” Tree Node to find the script.
Additional information
| Plugin-Type | Client VTL – Custom Indicator |
|---|---|
| Compatibility |

