$0.00
In stock
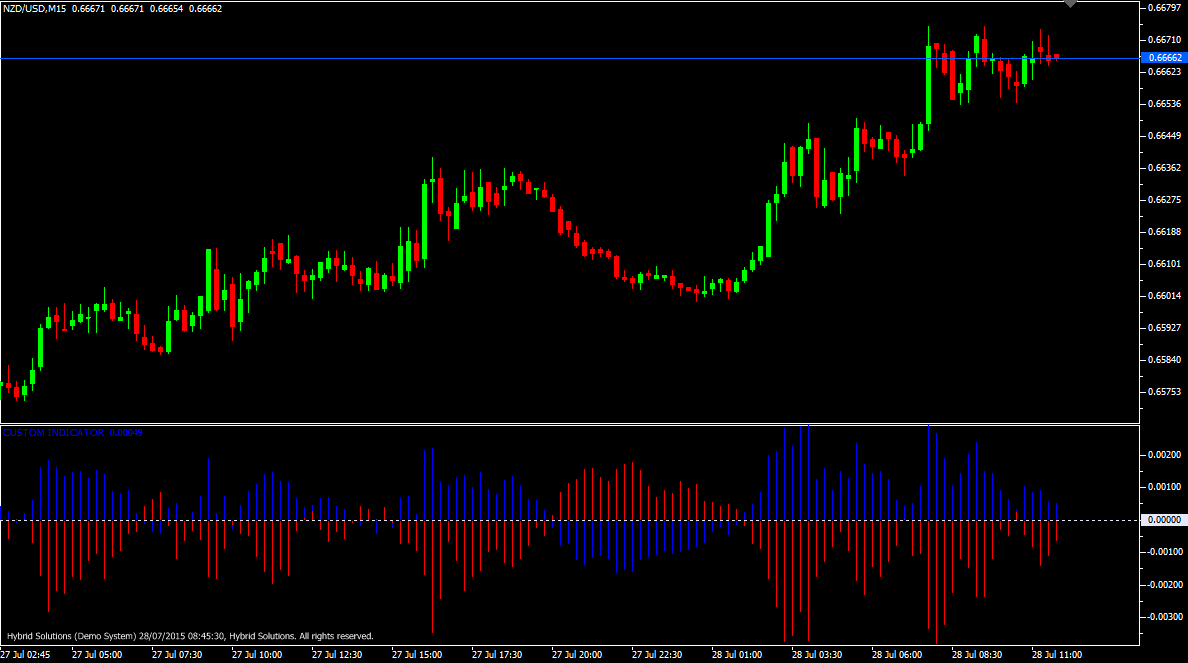
The iTrend oscillator is a client side VTL indicator useful for determination of start and end of trends. It is calculated from Bollinger Bands, Bulls Power and Bears Power components
(Downloads - 1520)

The iTrend oscillator is a client side VTL indicator useful for determination of start and end of trends. It is calculated from Bollinger Bands, Bulls Power and Bears Power components.
The iTrend indicator comprises of two components, the bullish (Blue) and bearish (Red) component. These bullish and bearish components oscillate around the center zero line. Buying is advised when bearish component reaches extremity above zero line (positive) and Bullish component reaches extremity below zero line (negative). Conversely, selling is advised when bearish component reaches extremity below zero line (negative) and the bullish component reaches extremity above zero line (positive). In other words, blue lines above zero and red lines below zero indicate bullish trend, and blue lines below zero and red lines above zero indicate bearish trend.
The bullish component (blue) is calculated by subtracting the Bollinger Band value from the current price. The bearish component (red) is calculated as the sum of the Bulls Power and Bears Power indicator multiplied by -1
Usage
- Download the attachment.
- Copy it to your company VertexFX Local VTL Files folder i.e. C:Program FilesCompany Namevtl10Local VTL Scripts
- Restart your Client Terminal or Right Click on “Local VTL Scripts” Tree Node to find the script.
Additional information
| Plugin-Type | Client VTL – Custom Indicator |
|---|---|
| Compatibility |

