$0.00
In stock
Impuls indicator is a VertexFX client side VTL indicator that is designed to identify inflection points where a trend speeds up or slows down.
Impuls indicator is based on two indicators: a 13-day Exponential Moving Average, that identifies the trend; the MACD-Histogram, to measures momentum (based on MACD(12,26,9)).
(Downloads - 1940)

Impuls indicator is a VertexFX client side VTL indicator that is designed to identify inflection points where a trend speeds up or slows down.
Impuls indicator is based on two indicators: a 13-day Exponential Moving Average, that identifies the trend; the MACD-Histogram, to measures momentum (based on MACD(12,26,9)).
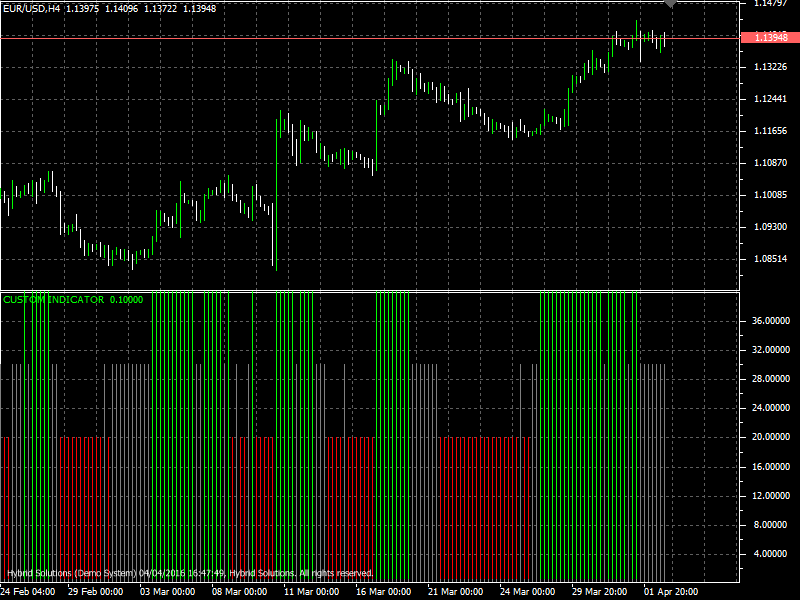
This unique system combination was color coded into the price bars for easy reference, giving origin to a useful indicator that combines trend following and momentum, to identify tradable market impulses.
Calculation and construction of the indicator:
When attaching this indicator to any chart, instead of two color histogram, as normally we are used to see (bullish and bearish candles), a third color will be appearing, which helps us to identify when the trend is slows down, If EMA is more than the previous EMA and MACD-Histogram is more than the previous MACD-Histogram then the corresponding price bar is colored in green (indicating bullishness). If EMA is less than the previous EMA and MACD-Histogram is less than the previous MACD-Histogram then the corresponding price bar is colored red (indicating bearishness). If the signals are mixed, then the price bar is colored by grey (indicating uncertainty).
This indicator can be used in almost all timeframes with good trading results. One method of using this, is to use 2 timeframes for signal confirmation. So if you are trading the Daily chart, if the impulse system is showing an entry, multiply your timeframe by 5 and check that chart to see if the impulse system is also showing the same entry direction. In this case, you would be using the Daily and Weekly charts. In other words, the weekly chart has to show a clear uptrend in order for a daily buy signal to be valid. On the other hand, the weekly chart has to show a clear downtrend in order for a daily sell signal to be valid. We can also use as filter an EMA-60 , where BUY orders are put above the EMA and SELL orders below the EMA.
Usage
- Download the attachment from vStore or directly from the vStore tab in your terminal by performing a right click on it and selecting Download & Install
- Copy it to your company VertexFX Local VTL Files folder i.e. C:ProgramDataVertexFX Client Terminals”Company name”VTL10Local VTL Scripts
- Restart your Client Terminal or Right Click on “Local VTL Scripts” Tree Node to find the script.
Additional information
| Plugin-Type | Client VTL – Custom Indicator |
|---|---|
| Compatibility |


Reviews
There are no reviews yet.