$0.00
In stock
IINWMARROWS indicator is a VertexFX client side VTL indicator that provides for an opportunity to detect various peculiarities and patterns in price dynamics which are invisible to the naked eye.
(Downloads - 1741)

IINWMARROWS indicator is a VertexFX client side VTL indicator that provides an opportunity to detect various peculiarities and patterns in price dynamics which are invisible to the naked eye.
IINWMARROWS is a semaphore signal indicator that is constructed based on the algorithm of the Exponential Moving Average (EMA). The concept behind this indicator is to identify market cycles based upon a combination of the Fast Exponential Moving Average and Slow Exponential Moving Average with different type of the price series (close and open). At first step, we calculate the Fast Exponential Moving Average of the Close prices over the recent FasterMA bars. In the next step, we calculate the Slow Exponential Moving Average of the Open prices over the recent SlowerMA bars. As the trend stalls, or starts moving sideways, this difference between the fast EMA and slow EMA starts reducing, and reaches its peak. This signals the end of the trend. When the trend reverses, the fast EMA again follows the price, and the difference between the fast EMA and slow EMA turns negative. This negative difference gradually increases and reaches a negative trough when the downtrend stalls. The same process repeats again on the next uptrend or downtrend. Hence it is very useful to trade in trending markets. The difference between the fast EMA and slow EMA also eliminates any sideways noise and providing clarity in the signal.
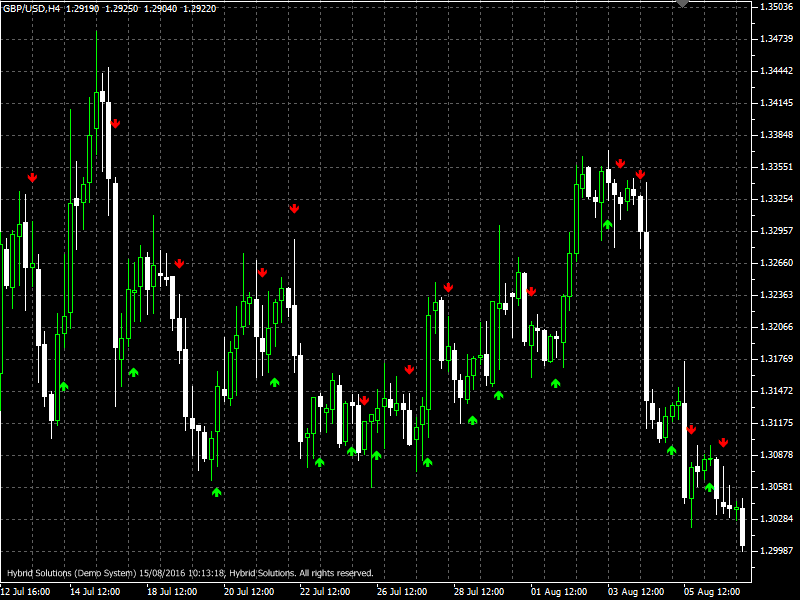
The indicator is presented as a arrows in red and green color. When the fast EMA crosses the slow EMA downward, then sell signal is formed. And when the fast EMA crosses the slow EMA from the bottom up, then a buy signal is generated.
BUY: Place Buy trade when Blue Buy arrow is displayed at the close of candle. Do not open Buy trade if candle has gap-up opening. Place stop-loss below the nearest Support level or nearest Swing Low level.
SELL: Place Sell trade when Red Sell arrow is displayed at the close of the candle. Do not open Sell trade if candle has gap-down opening. Place stop-loss above the nearest Resistance level or nearest Swing High level.
Usage
- Download the attachment from vStore or directly from the vStore tab in your terminal by performing a right click on it and selecting Download & Install
- Copy it to your company VertexFX Local VTL Files folder i.e. C:ProgramDataVertexFX Client Terminals”Company name”VTL10Local VTL Scripts
- Restart your Client Terminal or Right Click on “Local VTL Scripts” Tree Node to find the script.
Additional information
| Plugin-Type | Client VTL – Custom Indicator |
|---|---|
| Compatibility |

