$0.00
In stock
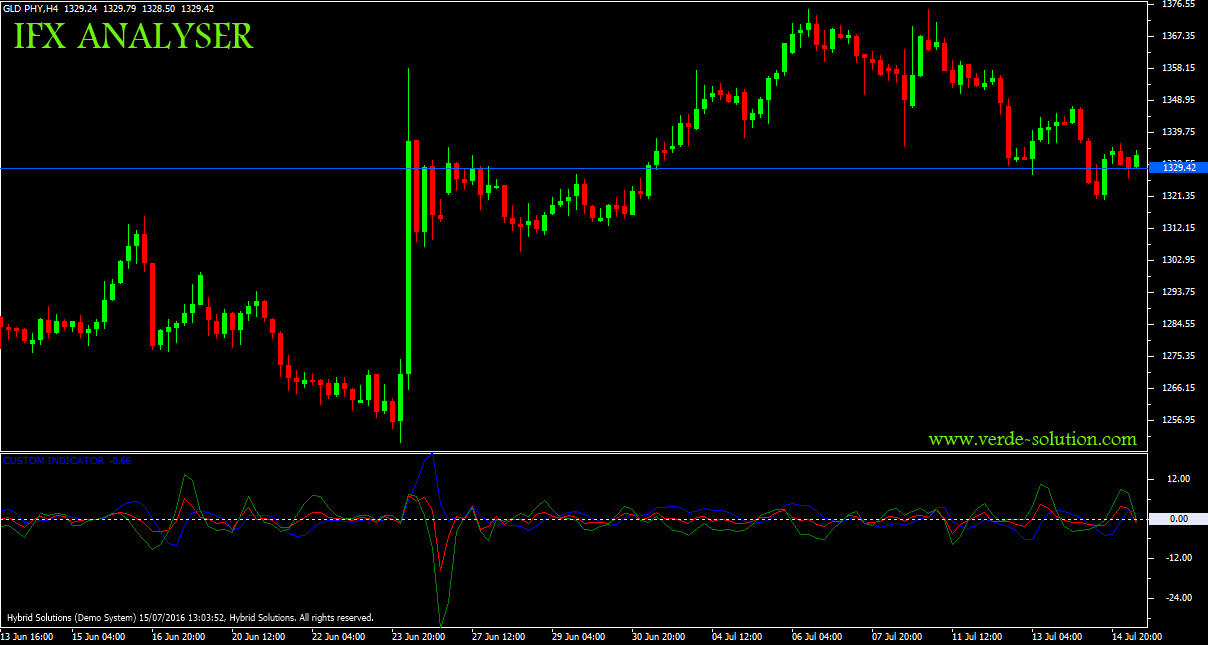
iFXAnalyser is an innovative indicator used to determine the strength of the trend using a fast and slow Simple Moving Average.
It uses a fast moving average and a slow moving average to identify the trend breakouts. The concept behind this indicator is that the fast moving average responds quickly compared to the slow moving average when the market direction changes. As a result, their difference increases when the market becomes trends in bullish or bearish direction.
(Downloads - 1832)

iFXAnalyser is an innovative indicator used to determine the strength of the trend using a fast and slow Simple Moving Average.
It uses a fast moving average and a slow moving average to identify the trend breakouts. The concept behind this indicator is that the fast moving average responds quickly compared to the slow moving average when the market direction changes. As a result, their difference increases when the market becomes trends in bullish or bearish direction. Likewise, the difference between the current value of the fast moving average and its previous value is greater than a similar difference in the slow moving average. This indicators a confirmation that the breakout trend is strong and can sustain. We calculate the fast and slow Simple Moving Averages over the FAST_MA_PERIOD and SLOW_MA_PERIOD respectively. This indicator has three component
Blue: This is the difference between the fast and the slow Simple Moving Averages.
Red: This is the difference between the previous fast and slow Moving Averages, and is subtracted from the difference between the current fast and slow Simple Moving Averages (BLUE).
Green: The difference between the fast and slow Simple Moving Averages is subtracted from the RED (which is the difference between the previous fast and slow Moving Averages is subtracted from the difference between the current fast and slow Simple Moving Averages).
When a strong trend begins, the BLUE line starts moving upwards in uptrends or downwards in downtrends. Prices tend to top-out when the BLUE line tops out, the GREEN line bottoms out, and the RED line is between the GREEN and BLUE lines. Prices tend to bottom-out when the BLUE line bottoms out, the GREEN line tops out, and the RED line is between the GREEN and BLUE lines.
Note: This indicator does not provide BUY or SELL signals. It only provides the strength of the trend.
Usage
- Download the attachment from vStore or directly from the vStore tab in your terminal by performing a right click on it and selecting Download & Install
- Copy it to your company VertexFX Local VTL Files folder i.e. C:ProgramDataVertexFX Client Terminals”Company name”VTL10Local VTL Scripts
- Restart your Client Terminal or Right Click on “Local VTL Scripts” Tree Node to find the script.
Additional information
| Plugin-Type | Client VTL – Custom Indicator |
|---|---|
| Compatibility |

