$0.00
In stock
Download and use Ichimoku Cloud for VertexFX Trader. Follow the easy steps to install this indicator.
(Downloads - 1535)

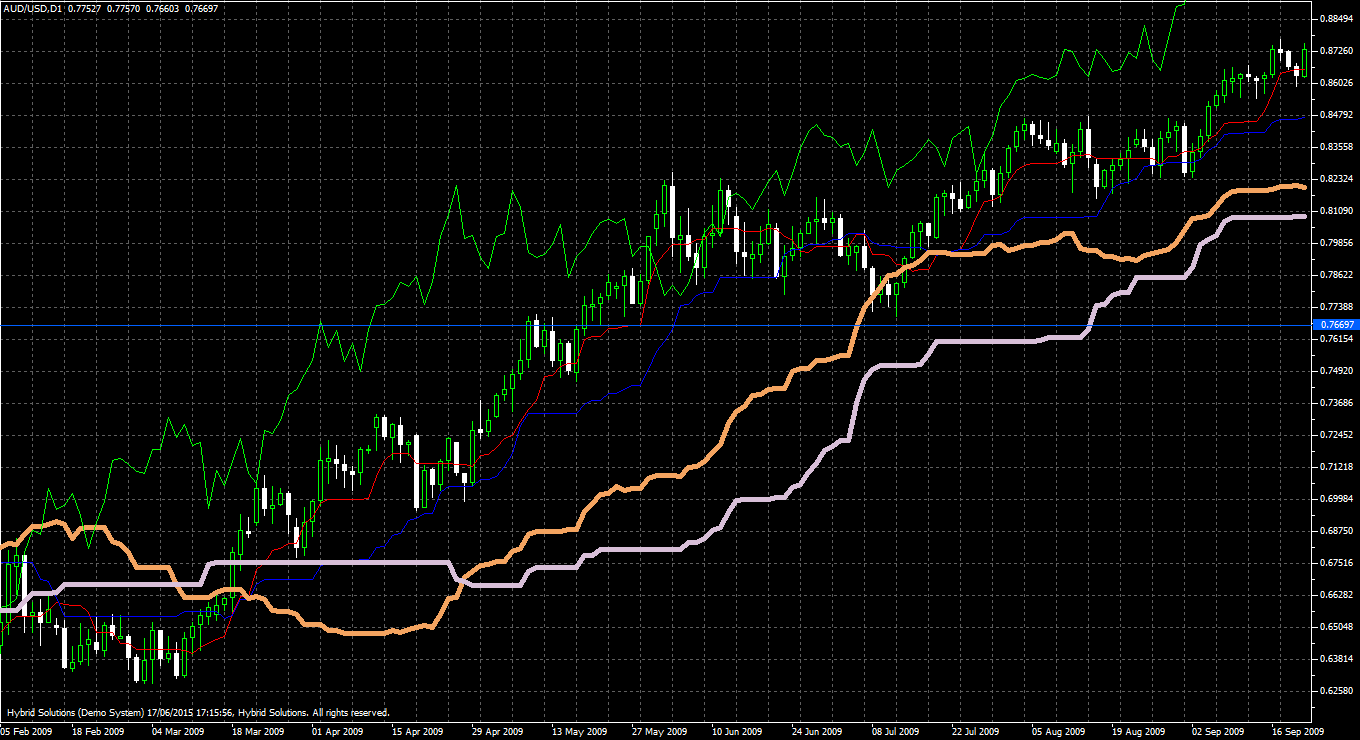
The Ichimoku Cloud indicator, known as “Ichimoku Kinko Hyo” or one look equilibrium chart is useful in identifying high probability trades. The Ichimoku chart consists of three lines (the red, blue and green line in chart) and a cloud. The red line is called Tenkan Sen or conversion line and the blue line is called Kijun Sen or base line. The green line is called Chikou Span or lagging span. The cloud is the area between the two thick lines.
These lines are called Senkou Span A,(pink line) and senkou Span B (steel blue line). The most important component of this indicator is the Ichimoku Cloud. The cloud behaves just like a normal support and resistance. However unlike normal support and resistance, the cloud offers a zone as support or resistance. The width of the cloud is related to underlying volatility in the currency.
Breakout through the cloud indicates a good trading opportunity in the direction of the breakout. Interpreting the Ichimoku chart. Strong Signals A strong buy signal occurs when the Tenkan-Sen (red line) crosses above the Kijun-Sen (blue line) from below. A strong sell signal occurs when the opposite occurs. The signals must be above cloud for a buy and below the cloud for a sell. Normal Signals A normal buy signal occurs when the Tenkan-Sen (red line) crosses above the Kijun-Sen (blue line) from below. A normal sell signal occurs when the opposite occurs. The signals must be within the cloud. Weak Signals A weak buy signal occurs when the Tenkan-Sen crosses above the Kijun-Sen from below. A weak sell signal occurs when the opposite occurs.
The signals must be below the cloud for a buy and above the cloud for a sell. Support/Resistance Levels Support and resistance levels are represented by the presence of the cloud. If the price is entering the cloud from below, then the price is at a resistance level. If the price is falling into the cloud, then there is a support level. Trends Trends can be determined by simply looking at where the current price is in relation to the cloud. If the price stays below the cloud, then there is a downward trend (bearish); if the price stays above the cloud, then there is an upward trend (bullish).
It may look complex at first sight but when the chart is broken down into components, even novice traders find the application easy and useful.
Usage
- Download the attachment.
- Copy it to your company VertexFX Local VTL Files folder i.e. C:Program FilesCompany Namevtl10Local VTL Scripts
- Restart your Client Terminal or Right Click on “Local VTL Scripts” Tree Node to find the script.
Additional information
| Plugin-Type | Client VTL – Custom Indicator |
|---|---|
| Compatibility |

