$0.00
In stock
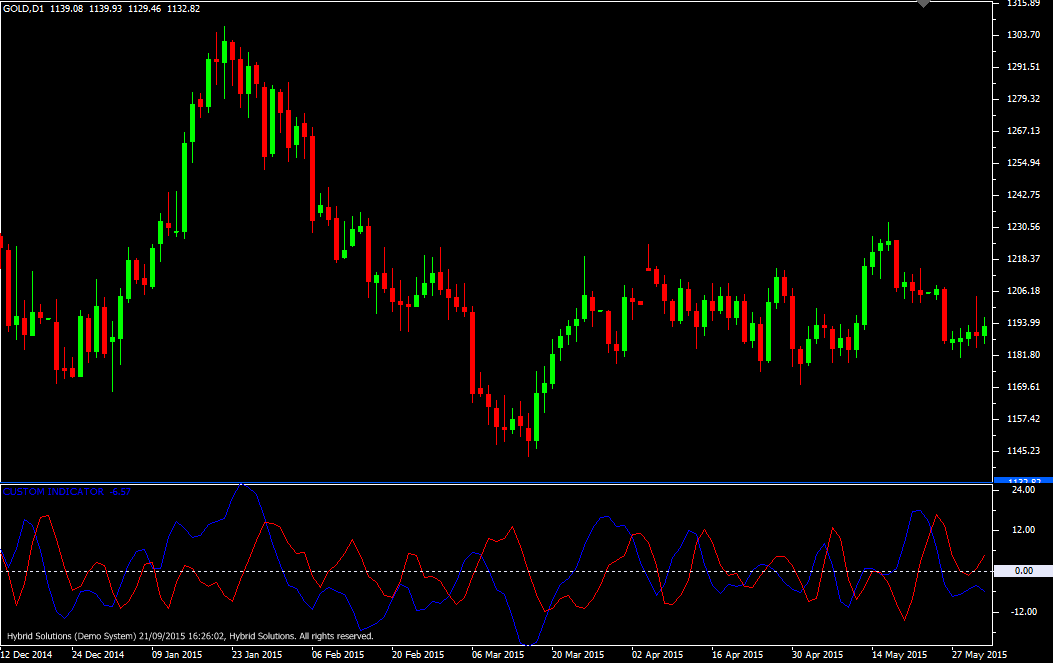
The Hilbert Transform is a powerful VertexFX indicator derived from the concepts of Digital Signal Processing (DSP). The Hilbert Transform is a procedure to create complex signals from simple chart data familiar to all traders. These complex signals are called InPhase (Cosine), and the Quadrature (Sine).
(Downloads - 1525)

The Hilbert Transform is a powerful VertexFX indicator derived from the concepts of Digital Signal Processing (DSP). The Hilbert Transform is a procedure to create complex signals from simple chart data familiar to all traders. These complex signals are called InPhase (Cosine), and the Quadrature (Sine).
These two components enable us to find the dominant cycle period, dominant cycle amplitude and the phase of the dominant cycle. The InPhase line is identified in Blue color, whereas the Quadrature line in Red color. At first we compute the 3-bar WMA, to remove the higher frequency components prior to trending price. Then we de-trend the price. Finally, we compute the InPhase and Quadrature components based on the Hilbert Transform formula.
Note that the Quadrature component is computed by applying the Hilbert Transform second time. The Hilbert Transform has a lag of 3 bars, which is acceptable.
BUY – Place Buy position when Blue (InPhase) line crosses above Red (Quadrature) line below the zero level.
SELL – Place Sell position when Blue (InPhase) line crosses below Red (Quadrature) line above the zero level.
Usage
- Download the attachment.
- Copy it to your company VertexFX Local VTL Files folder i.e. C:Program FilesCompany Namevtl10Local VTL Scripts
- Restart your Client Terminal or Right Click on “Local VTL Scripts” Tree Node to find the script.
Additional information
| Plugin-Type | Client VTL – Custom Indicator |
|---|---|
| Compatibility |

