$0.00
In stock
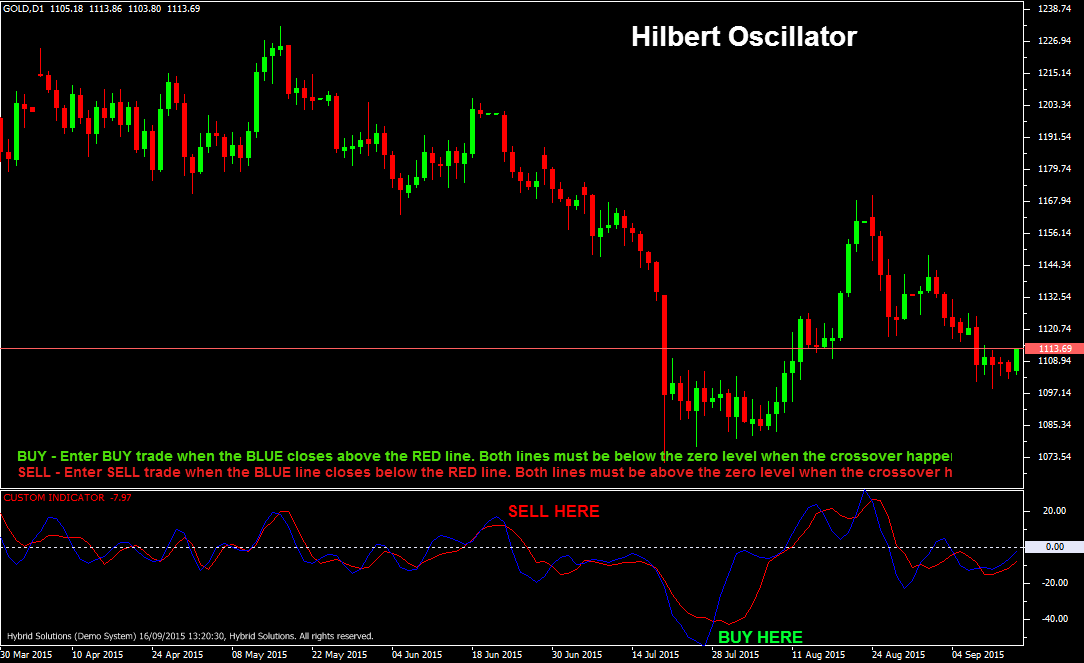
The Hilbert Oscillator is a powerful VertexFX Indicator for determining turning points in market cycles. It provides a minimal lag of 3 bars, which is an advantageous in early determination of trends and changes in trend.
(Downloads - 1454)

The Hilbert Oscillator is a powerful VertexFX Indicator for determining turning points in market cycles. It provides a minimal lag of 3 bars, which is an advantageous in early determination of trends and changes in trend.
Hilbert Oscillator is based on Hilbert Transform method. At first step, the price is smoothed using a 4-bar WMA. In next step the InPhase and Quadrature components are calculated, and then the dominant cycle period is calculated using the Homodyne Discriminator formula. This dominant cycle period is again smoothed. It consist of two components, the Hilbert Oscillator (Blue) and the Amplitude (Red). The Blue line leads the Red line in up trends, whereas the Red line leads the Blue line in downtrends. It provides excellent signals on higher time-frames, namely H4 and Daily periods.
BUY – Place Buy position when Blue line closes above Red line. Both lines must be below zero level when the crossover happens.
SELL – Place Sell position when Blue line closes below Red line. Both lines must be above the zero level when the crossover happens.
Usage
- Download the attachment.
- Copy it to your company VertexFX Local VTL Files folder i.e. C:Program FilesCompany Namevtl10Local VTL Scripts
- Restart your Client Terminal or Right Click on “Local VTL Scripts” Tree Node to find the script.
Additional information
| Plugin-Type | Client VTL – Custom Indicator |
|---|---|
| Compatibility |

