$0.00
In stock
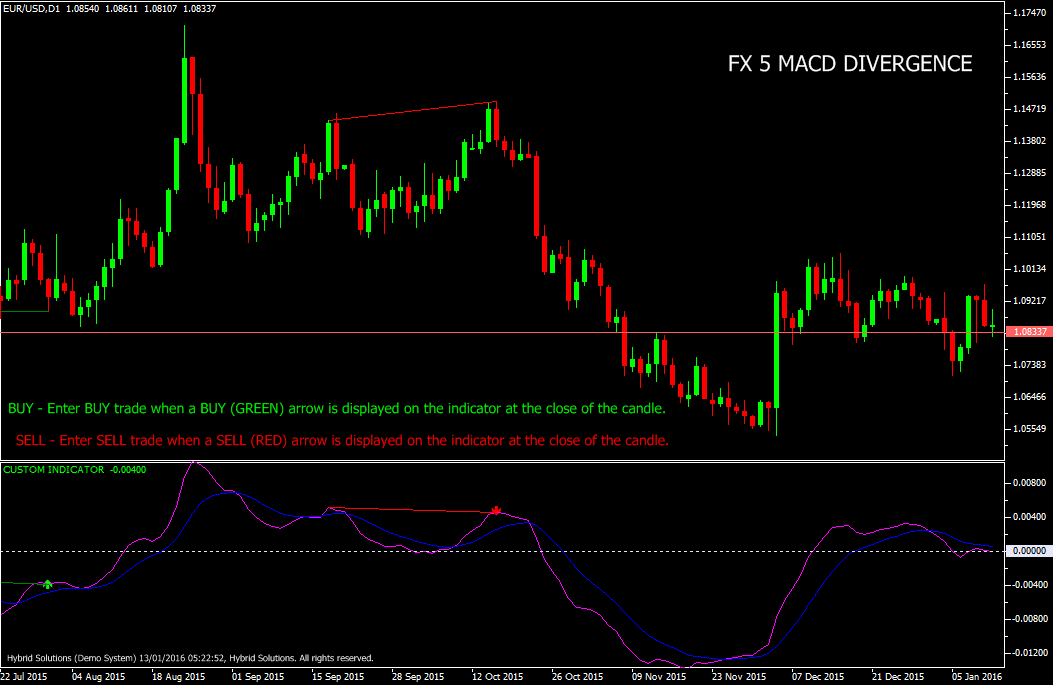
FX 5 MACD Divergence is a powerful VertexFX client side VTL indicator that gives precise entry and exit signals based upon divergence in MACD and price of the instrument.
The MACD indicator can be used as a trend or a momentum indicator. By using divergence we re-inforce the strength of the trend and uncover any weaknesses. The idea behind this indicator is to find channels during which the price makes a new swing high or a new swing low, but the corresponding MACD is either sideways or moving in the opposite direction. In other words, the divergence is a signal that the direction of the trend is about to change, or has changed.
(Downloads - 1555)

FX 5 MACD Divergence is a powerful VertexFX client side VTL indicator that gives precise entry and exit signals based upon divergence in MACD and price of the instrument.
The MACD indicator can be used as a trend or a momentum indicator. By using divergence we re-inforce the strength of the trend and uncover any weaknesses. The idea behind this indicator is to find channels during which the price makes a new swing high or a new swing low, but the corresponding MACD is either sideways or moving in the opposite direction. In other words, the divergence is a signal that the direction of the trend is about to change, or has changed.
At first step, we calculate the MACD indicator based upon the MACD FAST and MACD SLOW period. The difference between these two is the Magenta line. In the next step, we calculate the signal (Blue) which is the moving average of the Magenta line based on the MACD SIGNAL period. When the price makes a new swing High, but the MACD indicator (Magenta) is moving downwards, a negative divergence is detected, and a SELL signal is triggered. When the price makes a new Swing Low, but the MACD indicator (Magenta) is moving upwards, a position divergence is detected, and a BUY signal is triggered.
Inputs :
MACD Fast: The period used to calculate the fast moving average for the MACD calculation.
MACD Slow: The period used to calculate the slow moving average for the MACD calculation.
MACD Signal: The period used to calculate the MACD signal.
Lookback Bars: The number of recent bars in history to look back from the the latest bar to draw the arrows and trendlines. This value does not affect the location of the arrows or the trendlines, only improves the speed of the indicator.
Draw Price Trendlines: Specifies whether to draw trendlines on the price.
Draw Indicator Trendline: Specifies whether to draw trendlines on the indicator.
Arrow Displacement: The amount by which to display the BUY arrow downwards, and the SELL arrow upwards on the indicator for clarity. This does not affect the location of the arrows
Buy: Place Buy trade when a Buy (Green) arrow is displayed on the indicator at the close of the candle. Do not place buy trade if candle has gap-up opening.
Sell: Place Sell trade when a Sell (Red) arrow is displayed on the indicator at the close of the candle. Do not open sell trade if candle has gap-down opening.
Usage
- Download the attachment from vStore or directly from the vStore tab in your terminal by performing a right click on it and selecting Download & Install
- Copy it to your company VertexFX Local VTL Files folder i.e. C:ProgramDataVertexFX Client Terminals”Company name”VTL10Local VTL Scripts
- Restart your Client Terminal or Right Click on “Local VTL Scripts” Tree Node to find the script.
Additional information
| Plugin-Type | Client VTL – Custom Indicator |
|---|---|
| Compatibility |

