$0.00
In stock
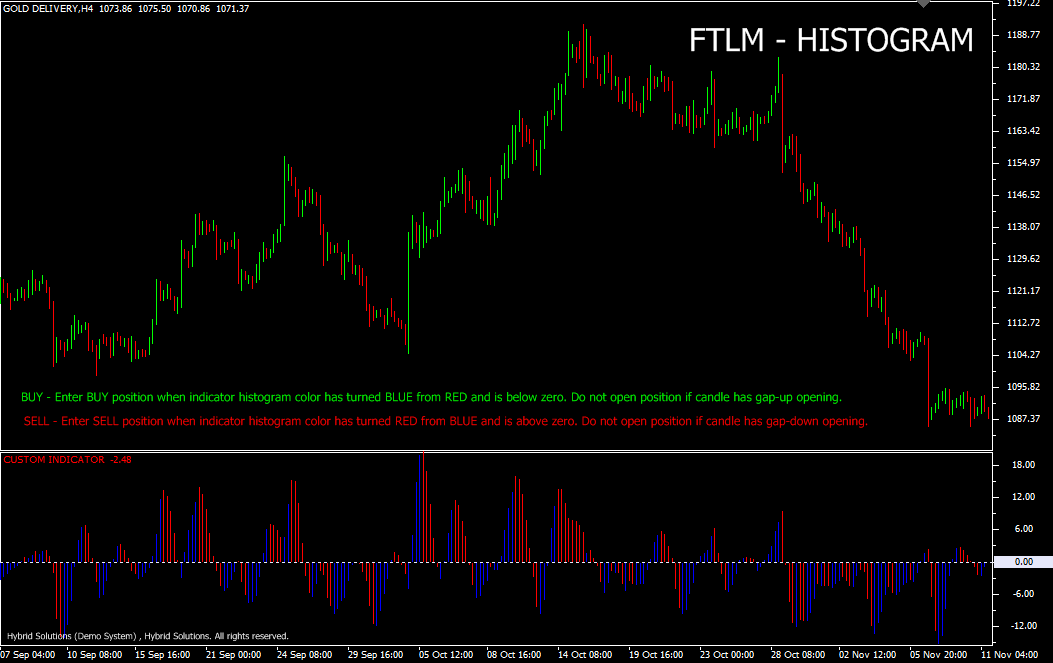
FTLM (Fast Trendline Momentum Histogram) is a powerful VertexFX client side VTL indicator that gives excellent entry and exit signals based on trend following methodology.
It is based on Digital Signal Processing (DSP) method using digital signal co-efficient for smoothing the price and trend movements. This indicator requires at least 45 bars since it applies the filter co-efficient to the most recent 45 bars.
(Downloads - 1545)

FTLM (Fast Trendline Momentum Histogram) is a powerful VertexFX client side VTL indicator that gives excellent entry and exit signals based on trend following methodology.
It is based on Digital Signal Processing (DSP) method using digital signal co-efficient for smoothing the price and trend movements. This indicator requires at least 45 bars since it applies the filter co-efficient to the most recent 45 bars.
The FTLM is calculated as the difference between the up-trending filtered co-efficient of the recent 45 bars and the down-trending filtered co-efficient of the recent 45 bars. Each close is multiplied by a co-efficient and then sum of these recent 45 closes is added to derive the FTLM. When this difference is increasing the histogram color is BLUE, whereas when it is decreasing then the histogram color is RED.
The concept is that the sideways price movements cancel each other out, and only the core trend direction remains in the calculation. When the trend direction has an upward bias, down-trend signals are filtered out, and when the trend direction has a downward bias, the up-trend signals are filtered out. This indicator has a faster response than the STLM (Slow Trend line Momentum Histogram) as it requires half the number of bars as compared to STLM. This indicator is useful for short-term trends, whereas STLM is useful for long-term trends.
Buy: Place Buy position when indicator histogram color has turned Blue from Red and is below zero. Do not open position if candle has gap-up opening. Stop loss can be placed at the nearest swing low.
Sell: Place Sell position when indicator histogram color has turned RED from BLUE and is above zero. Do not open position if candle has gap-down opening. Stop loss can be placed at the nearest swing high.
Usage
- Download the attachment from vStore or directly from the vStore tab in your terminal by performing a right click on it and selecting Download & Install
- Copy it to your company VertexFX Local VTL Files folder i.e. C:ProgramDataVertexFX Client Terminals”Company name”VTL10Local VTL Scripts
- Restart your Client Terminal or Right Click on “Local VTL Scripts” Tree Node to find the script.
Additional information
| Plugin-Type | Client VTL – Custom Indicator |
|---|---|
| Compatibility |

