$0.00
In stock
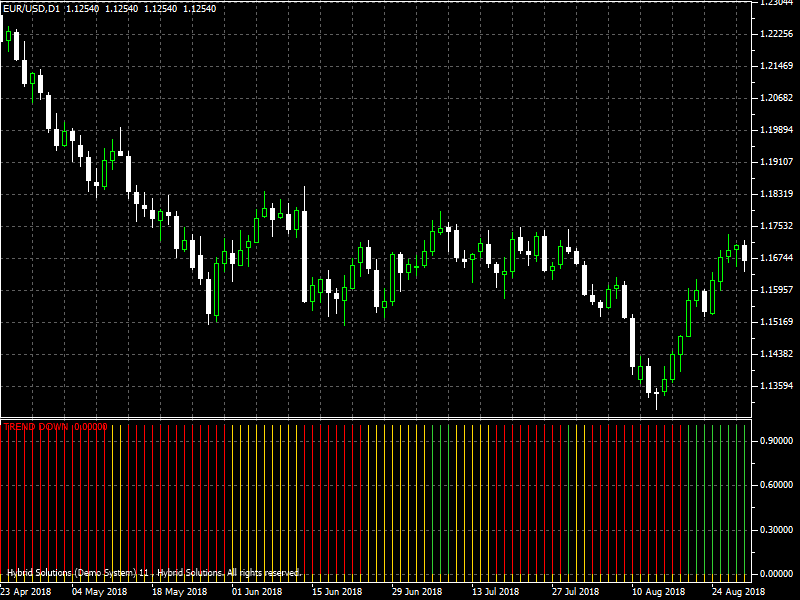
Flat Trend Indicator is a VertexFX indicator that identifies the prevailing trend in the chart. It plots a green histogram when the price is in an uptrend, in a downtrend it plots the red histogram and in sideways markets it plots a yellow histogram.
(Downloads - 1240)

Flat Trend Indicator is a VertexFX indicator that identifies the prevailing trend in the chart. It plots a green histogram when the price is in an uptrend, in a downtrend it plots the red histogram and in sideways markets it plots a yellow histogram.
With this indicator applied on the chart, trend identification can be easily done by looking at the indicator panel. The trend is identified by combining Parabolic stop and reverse indicator (PSAR) and ADX indicator. When PSAR is in buy mode and ADX is showing an uptrend, the trend is marked as up. When PSAR is in sell mode and ADX is showing downtrend, the trend is marked as down. All other situations are marked as a neutral trend.
This indicator is useful to identify the prevailing trend in the market and traders can tune their system to take positions in the trend direction. Discretionary traders can use it to align their position in the trend direction.
The RSI indicator is used to identify the overbought oversold situation in the market. However, in trending markets, going short when RSI indicates an overbought situation is not a good trade. With this Flat trend indicator, if the trend is flat and RSI reaches overbought, levels, opening a sell position has better chances of winning. Many traditional indicators performance can be improved by using Flat Trend indicator as a trade filter.
Usage
- Download the attachment from vStore or directly from the vStore tab in your terminal by performing a right click on it and selecting Download & Install
- Copy it to your company VertexFX Local VTL Files folder i.e.C:Users”Username”AppDataRoamingVertexFX Client Terminals“Company name”VTL10Local VTL Scripts
- Restart your Client Terminal or Right Click on “Local VTL Scripts” Tree Node to find the script.
Hindi Version
फ्लैट ट्रेंड इंडिकेटर चार्ट में प्रचलित प्रवृत्ति की पहचान करता है। जब यह अपट्रेंड में होता है, तो यह एक हरे रंग का हिस्टोग्राम प्लॉट करता है, नीचे की प्रवृत्ति में यह लाल हिस्टोग्राम प्लॉट करता है और बग़ल में बाजारों में यह एक पीला हिस्टोग्राम प्लॉट करता है। इस संकेतक को चार्ट पर लागू करने के साथ, संकेतक पैनल को देखकर प्रवृत्ति की पहचान आसानी से की जा सकती है।
प्रवृत्ति की पहचान परवलयिक स्टॉप और रिवर्स इंडिकेटर (PSAR) और ADX इंडिकेटर के संयोजन से की जाती है। जब PSAR खरीद मोड में होता है और ADX अपट्रेंड दिखा रहा होता है, तो प्रवृत्ति को ऊपर के रूप में चिह्नित किया जाता है। जब PSAR बिकने वाले मोड में है और ADX डाउन ट्रेंड दिखा रहा है, तो ट्रेंड नीचे के रूप में चिह्नित है।
यह सूचक बाजार में प्रचलित प्रवृत्ति की पहचान करने के लिए उपयोगी है और व्यापारी अपने सिस्टम को प्रवृत्ति दिशा में स्थिति लेने के लिए ट्यून कर सकते हैं। विवेकाधीन व्यापारी प्रवृत्ति दिशा में अपनी स्थिति संरेखित करने के लिए इसका उपयोग कर सकते हैं। RSI इंडिकेटर का उपयोग बाजार में ओवरबॉट ओवरसोल्ड स्थिति की पहचान करने के लिए किया जाता है। हालांकि, ट्रेंडिंग मार्केट्स में, जब RSI इंगित करता है कि छोटी स्थिति में जाना एक अच्छा व्यापार नहीं है। इस फ्लैट ट्रेंड संकेतक के साथ, यदि प्रवृत्ति सपाट है और RSI ओवरबॉट, स्तरों पर पहुंचता है, तो बेचने की स्थिति खोलने से जीतने की बेहतर संभावना होती है। ट्रेड फ़िल्टर के रूप में फ्लैट ट्रेंड इंडिकेटर का उपयोग करके कई पारंपरिक संकेतकों के प्रदर्शन में सुधार किया जा सकता है।
प्रयोग विस्टोर से अटैचमेंट डाउनलोड करें या सीधे अपने टर्मिनल में विस्टोर टैब से इसे राइट क्लिक करके डाउनलोड करें और इंस्टॉल करें चुनें। इसे अपनी कंपनी VertexFX स्थानीय वीटीएल फ़ाइलें फ़ोल्डर में कॉपी करें, अर्थात C:Users”Username”AppDataRoamingVertexFX Client Terminals”Company name”VTL10Local VTL Scripts स्क्रिप्ट ढूंढने के लिए “स्थानीय वीटीएल स्क्रिप्ट” ट्री नोड पर अपने क्लाइंट टर्मिनल या राइट क्लिक को पुनरारंभ करें।
Additional information
| Plugin-Type | Client VTL – Custom Indicator |
|---|---|
| Compatibility |

