$0.00
In stock
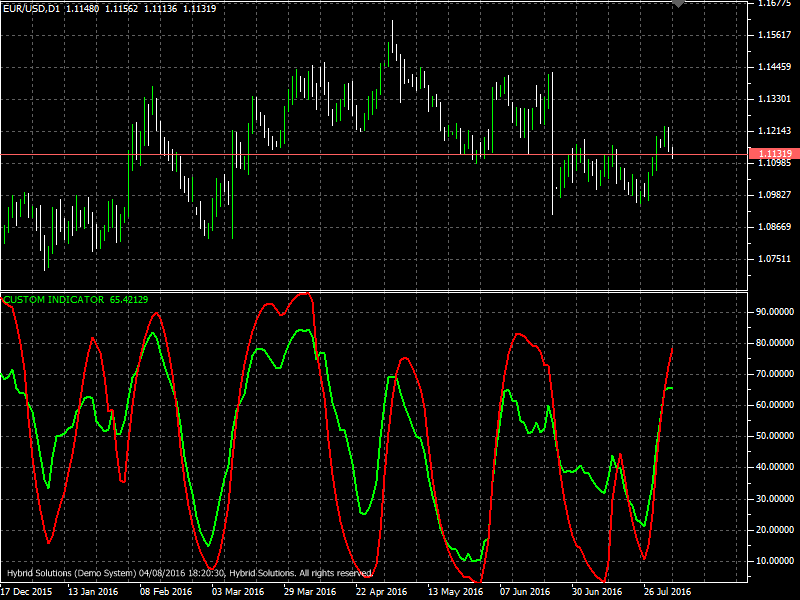
DSS Bressert is a VertexFX client side VTL indicator that is double smoothed stochastic, and is very similar to Stochastic, but in fact, very different from it. This indicator was developed by William Blau and Walter Bressert, each of which presented their version of the formula of the “new stochastic” and both of these formulas were used to create DSS Bressert indicator.
(Downloads - 1789)

DSS Bressert is a VertexFX client side VTL indicator that is double smoothed stochastic, and is very similar to Stochastic, but in fact, very different from it. This indicator was developed by William Blau and Walter Bressert, each of which presented their version of the formula of the “new stochastics” and both of these formulas were used to create DSS Bressert indicator.
In fact, it turned out that one of the formulas calculates the main line, and on the other calculates the signal. In particular, the main line (default red) was calculated according to the formula of Walter Bressert. Both formulas to calculate all indicators are constructed so that they require only 2 indicate incoming value is a period of “stochastic” and period exponential moving average.
Method of calculation of the indicator:
Calculation of the DSS indicator according to Bressert is similar to stochastics.
1. First the difference between the current close and the period low is formed. The denominator: here the difference between the period high minus the period low is calculated. Now the quotient of numerator and denominator is calculated, exponentially smoothed and then multiplied by 100.
2. The method is analogous to paragraph 1 with the distinction that now the prices of the newly calculated price series of paragraph 1 is used.
Indicator parameters:
The adjustable period length can be chosen from 2 to 500. The most common settings will have a period length ranging from 5 to 30. In addition, the indicator can be smoothed in the interval from 1 to 50. Meaningful smoothing values lie in the short-term range.
The application of the DSS is comparable with that of the stochastic method. Accordingly, values above 70 or 80 must be regarded as overbought and values below 20 or 30 as oversold. A rise of the DSS above its center line should be viewed as bullish, and a fall of the DSS below its center line as bearish.
Usage
- Download the attachment from vStore or directly from the vStore tab in your terminal by performing a right click on it and selecting Download & Install
- Copy it to your company VertexFX Local VTL Files folder i.e. C:ProgramDataVertexFX Client Terminals”Company name”VTL10Local VTL Scripts
- Restart your Client Terminal or Right Click on “Local VTL Scripts” Tree Node to find the script.
Additional information
| Plugin-Type | Client VTL – Custom Indicator |
|---|---|
| Compatibility |

