$0.00
In stock
(Downloads - 25)

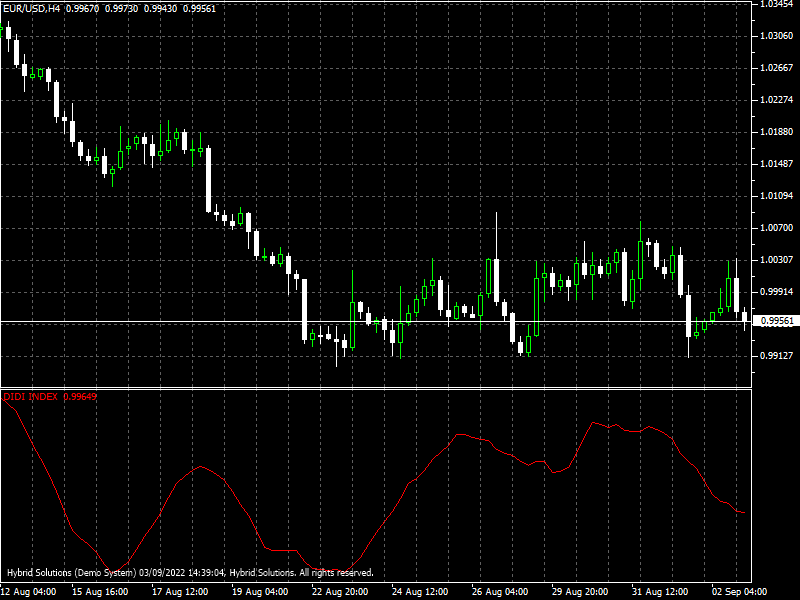
Didi index Clean and Reversed is a VertexFX VTL indicator. It is adapted from the Didi index indicator. In this version, the slow line is the only line to be displayed. The Didi index is based on Moving Averages (MA) and shows the trend direction. Didi Index Clean and Reversed CR is used in different ways by traders. When the Index is above 1, the trend is up, when it is below 1, the trend is down. In the original version of the Didi Index, the Trend is up when the slow line is below 1. Hence the name is reversed.
A simple method to trade is when the Didi index cross above the middle line, open a long trade, if it crosses below the middle line, open a short position. The middle line is placed at 1. Use a fixed target and stop loss or base stop loss on support resistance levels. As the index shows the trend, one can open positions when pullback happens to a support/resistance level
Parameters:
MA Method: Moving average type, 1 SMA, 2 EMA, 3 WMA
Applied Price: Price field for indicator calculation, 1 Close, 2 Open, 3 High, 4 Low, 5 Median, 6 Typical, 7 Weighted
Mean Period: Mean MA Period
Slow Period: Slow MA Period
Try a different set of parameter values and back-test the indicator before starting to trade with Didi Index. The indicator can be coupled with other indicators to generate reliable trading signals.
Usage
- Download the attachment from vStore or directly from the vStore tab in your terminal by performing a right-click on it and selecting Download & Install
- Copy it to your company VertexFX Local VTL Files folder i.e.C:Users”Username”AppDataRoamingVertexFX Client Terminals“Company name”VTL11Local VTL Scripts
- Restart your Client Terminal or Right Click on “Local VTL Scripts” Tree Node to find the script.
Hindi Version:
दीदी इंडेक्स क्लीन एंड रिवर्सेड एक क्लाइंट साइड वर्टेक्सएफएक्स वीटीएल इंडिकेटर है। इसे दीदी इंडेक्स इंडिकेटर से अनुकूलित किया गया है। इस संस्करण में धीमी रेखा प्रदर्शित होती है। डिड इंडेक्स मूविंग एवरेज पर आधारित है और ट्रेंड की दिशा दिखाता है। दीदी इंडेक्स सीआर व्यापारियों द्वारा अलग-अलग तरीकों से उपयोग किया जाता है। जब सूचकांक 1 से ऊपर होता है, तो प्रवृत्ति ऊपर होती है, जब यह 1 से नीचे होती है, तो प्रवृत्ति नीचे होती है। दीदी इंडेक्स के मूल संस्करण में, स्लो लाइन 1 से नीचे होने पर ट्रेंड ऊपर होता है। इसलिए नाम उलट गया।
व्यापार करने का एक सरल तरीका यह है कि जब दीदी सूचकांक मध्य रेखा से ऊपर हो, एक लंबा व्यापार खोलें, यदि यह मध्य रेखा से नीचे है, तो एक छोटी स्थिति खोलें। मध्य रेखा को 1 पर रखा गया है। समर्थन प्रतिरोध स्तरों पर एक निश्चित लक्ष्य और स्टॉपलॉस या बेस स्टॉपलॉस का उपयोग करें। जैसा कि सूचकांक प्रवृत्ति दिखाता है, कोई समर्थन/प्रतिरोध स्तर पर पुलबैक होने पर स्थिति खोल सकता है।
पैरामीटर:
एमए विधि: मूविंग एवरेज टाइप, 1 एसएमए, 2 ईएमए, 3 डब्लूएमए
अनुप्रयुक्त मूल्य: संकेतक गणना के लिए मूल्य क्षेत्र, 1 बंद, 2 खुला, 3 उच्च, 4 निम्न, 5 माध्यिका, 6 विशिष्ट, 7 भारित
मीन अवधि: मीन एमए अवधि
धीमी अवधि: धीमी एमए अवधि
दीदी इंडेक्स के साथ व्यापार शुरू करने से पहले पैरामीटर मानों के विभिन्न सेटों का प्रयास करें और संकेतक का परीक्षण करें। विश्वसनीय व्यापारिक संकेत उत्पन्न करने के लिए संकेतक को अन्य संकेतकों के साथ जोड़ा जा सकता है।
प्रयोग:
विस्टोर से अटैचमेंट डाउनलोड करें या सीधे अपने टर्मिनल में विस्टोर टैब से इसे राइट क्लिक करके डाउनलोड करें और इंस्टॉल करें चुनें।
इसे अपनी कंपनी VertexFX स्थानीय वीटीएल फ़ाइलें फ़ोल्डर में कॉपी करें, अर्थात C:Users”Username”AppDataRoamingVertexFX Client Terminals”Company name”VTL11Local VTL Scripts
अपने क्लाइंट टर्मिनल को पुनः आरंभ करें या स्क्रिप्ट खोजने के लिए “स्थानीय वीटीएल लिपियों” ट्री नोड पर राइट क्लिक करें।
Additional information
| Compatibility | |
|---|---|
| Plugin-Type | Client VTL – Custom Indicator |


Reviews
There are no reviews yet.