
Cronex T MA Parabolic

$0.00
Cronex T MA Parabolic is a VertexFX client side VTL indicator that is based on the Parabolic SAR, calculation of MA (Moving Average).
It provides excellent entry and exit signals for trend following. Cronex T MA Parabolic indicator concept is that the bullish market, the parabolic signal is smooth and is closely monitoring the changes in the prices below. As the market is neutral, the parabolic signal is higher than the price, hence the bearish indicator. At this stage, it is advisable to get out of bullish positions and enter a bearish position. Now, when the market starts to fall, the parabolic signal again becomes smooth and is closely monitoring the price above. Finally, when the bearish trend is over, the parabolic signal switches higher prices, indicating the end of the bearish trend and the beginning of a bullish trend.
(Downloads - 1648)
Cronex T MA Parabolic is a VertexFX client side VTL indicator that is based on the Parabolic SAR, calculation of MA (Moving Average).
It provides excellent entry and exit signals for trend following. Cronex T MA Parabolic indicator concept is that the bullish market, the parabolic signal is smooth and is closely monitoring the changes in the prices below. As the market is neutral, the parabolic signal is higher than the price, hence the bearish indicator. At this stage, it is advisable to get out of bullish positions and enter a bearish position. Now, when the market starts to fall, the parabolic signal again becomes smooth and is closely monitoring the price above. Finally, when the bearish trend is over, the parabolic signal switches higher prices, indicating the end of the bearish trend and the beginning of a bullish trend.
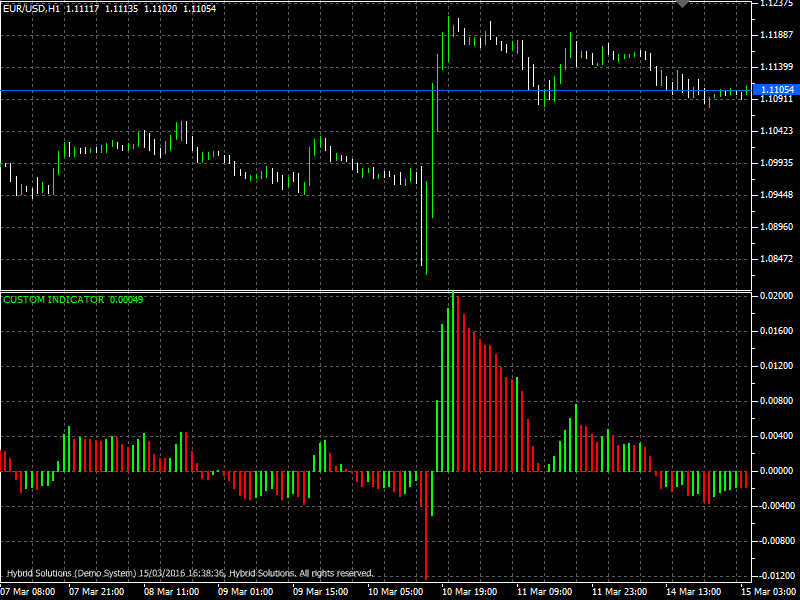
In the first step we calculate the Cronex T MA Parabolic indicator. In second stage, we calculate the difference between the closing price and values of Parabolic SAR. This difference is the value of the indicator.
Buy Signal: Place Buy position at close of candle when indicator histogram color has turned Green from Red and is below zero. Do not open position if candle has gap-up opening. Stop loss can be placed at the nearest swing low.
Sell Signal: Place Sell position at close of candle when indicator histogram color has turned Red from Green and is above zero. Do not open position if candle has gap-down opening. Stop loss can be placed at the nearest swing high.
Usage
- Download the attachment from vStore or directly from the vStore tab in your terminal by performing a right click on it and selecting Download & Install
- Copy it to your company VertexFX Local VTL Files folder i.e. C:ProgramDataVertexFX Client Terminals”Company name”VTL10Local VTL Scripts
- Restart your Client Terminal or Right Click on “Local VTL Scripts” Tree Node to find the script.
Additional information
| Plugin-Type | Client VTL – Custom Indicator |
|---|---|
| Compatibility |