$0.00
In stock
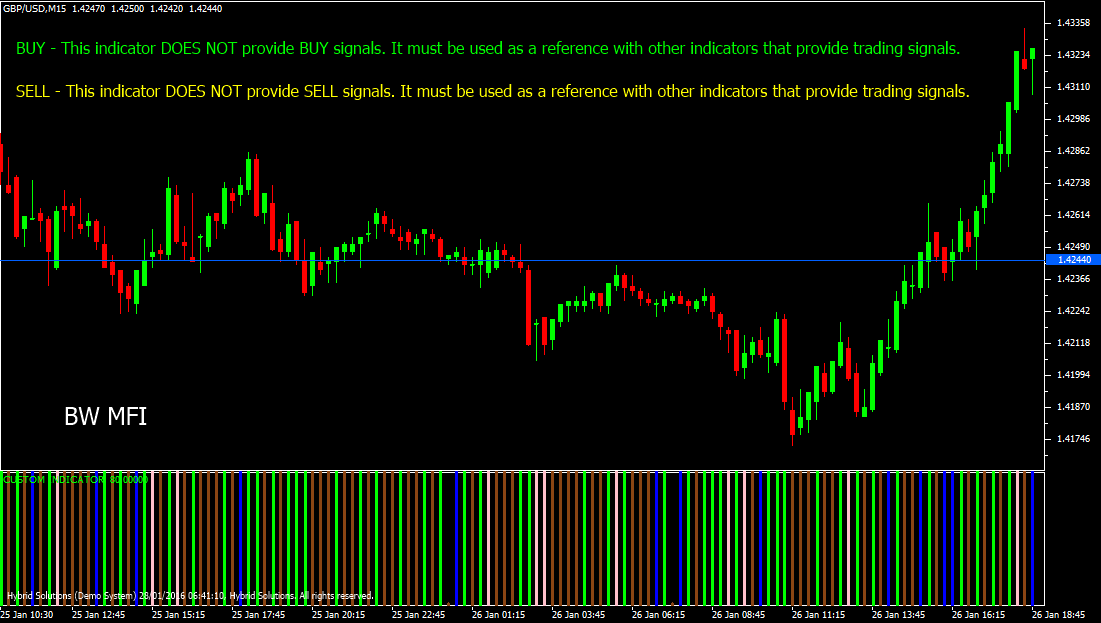
BW MFI indicator is a useful Vertex FX client-side indicator script that provides reference of the current market trend and characteristics. It should be used in conjunction with other trend-following indicators since this indicator does not provide any signals of its own. The Bill Williams Market Facilitation Index (BW MFI) provides us with characteristics of the market participants based upon the trading range, volume and change in the direction of the trend.
(Downloads - 1615)

BW MFI indicator is a useful Vertex FX client-side indicator script that provides reference of the current market trend and characteristics. It should be used in conjunction with other trend-following indicators since this indicator does not provide any signals of its own. The Bill Williams Market Facilitation Index (BW MFI) provides us with characteristics of the market participants based upon the trading range, volume and change in the direction of the trend.
In the first step, we calculate the difference between the High and the Low of the bar. This value is expressed in points and is the BW MFI indicator value. In the second step, we calculate the Simple Moving Average (SMA) of the High over the recent MFI PERIOD bars. In the third step, we calculate the Simple Moving Average (SMA) of the Low over the recent MFI PERIOD bars. The value calculated in the third step is subtracted from the value calculated in the second step. This difference is the strength component of the indicator.
There are four components of the BW MFI indicator:
1) Green – Implies a strong bullish trend. The market participants are bullish, and the market is attracting more buyers. It is likely that the price will move upwards strongly. This is the color of the histogram when the BW MFI is rising, and the strength component is rising.
2) Brown – Implies a strong bearish trend. The market participants are bearish, and the market is attracting more sellers, or the buyers are exiting. It is likely that the price will move downwards strongly. This is the color of the histogram when the BW MFI is falling, and the strength component is falling.
3) Blue – Implies a mild bullish trend, or an exhaustion of the bullish trend. The market participants are reducing their bullish positions. It is likely that the price will move sideways, or consolidate for a bearish downtrend. This is the color of the histogram when the BW MFI is rising, but the strength component is falling.
4) Pink – Implies a mild bearish trend, or an exhaustion of the bearish trend. The market participants are reducing their bearish positions. It is likely that the price will move sideways, or consolidate for a bullish uptrend. This is the color of the histogram when the BW MFI is falling, but the strength component is rising.
Usage
- Download the attachment from vStore or directly from the vStore tab in your terminal by performing a right click on it and selecting Download & Install
- Copy it to your company VertexFX Local VTL Files folder i.e. C:ProgramDataVertexFX Client Terminals”Company name”VTL10Local VTL Scripts
- Restart your Client Terminal or Right Click on “Local VTL Scripts” Tree Node to find the script.
Additional information
| Plugin-Type | Client VTL – Custom Indicator |
|---|---|
| Compatibility |

