$0.00
In stock
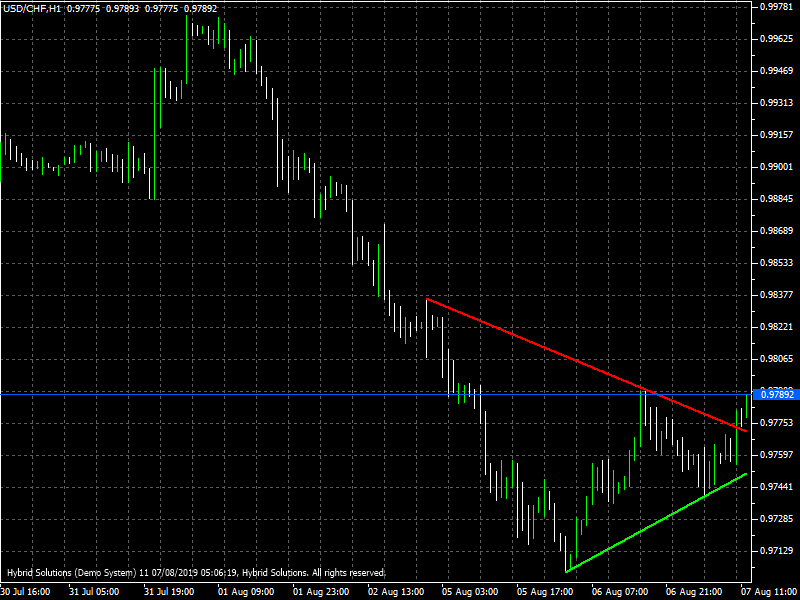
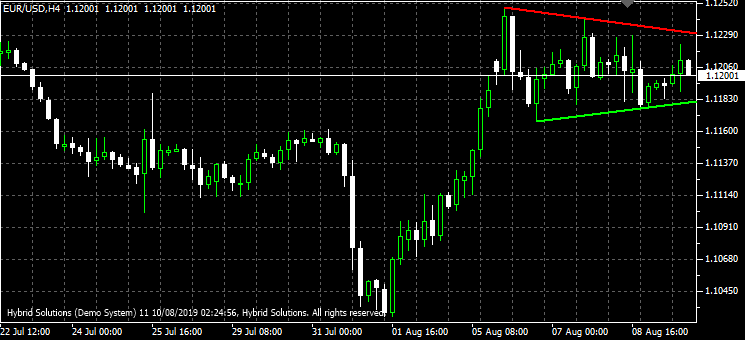
Auto Trend Lines is a VTL Client-Side indicator to plot trend lines. It detects the peaks and troughs in the chart and then plot trend lines joining recent peaks for downtrend line and the recent troughs for uptrend line.
(Downloads - 1220)

Auto Trend Lines is a VertexFX indicator to plot trend lines. It detects the peaks and troughs in the chart and then plot trend lines joining recent peaks for downtrend line and the recent troughs for uptrend line. Trend lines are usually considered as strong Support and Resistance levels. Traders can open buy positions when the downtrend line is broken, and the price remains above the trend line. Sell position can be opened when the uptrend line is broken, and the price remains below the trend line.

Auto Trend Lines VTL can be used to identify geometrical chart patterns like Triangles and Flags. Symmetrical Triangles, Ascending triangles and descending triangles can be easily identified. Up and down flags can be identified with the help of this indicator. It can be used to identify many other chart patterns like trend channels, pennants, etc.

Parameters :
1. Period – This parameter determines the strength of peaks and troughs for plotting trend lines. The default value is 10. Change this parameter value to get proper trend lines, increasing the value will draw long terms trend lines and decreasing the parameter will draw short term trend lines.
2. Limit – This determines the number of bars to look back for trend lines.
Usage
- Download the attachment from vStore or directly from the vStore tab in your terminal by performing a right-click on it and selecting Download & Install
- Copy it to your company VertexFX Local VTL Files folder i.e.C:Users”Username”AppDataRoamingVertexFX Client Terminals“Company name”VTL10Local VTL Scripts
- Restart your Client Terminal or Right Click on “Local VTL Scripts” Tree Node to find the script.
Hindi Version
ऑटो ट्रेंड लाइन्स ट्रेंड लाइन्स को प्लॉट करने के लिए वीटीएल क्लाइंट-साइड इंडिकेटर है। यह चार्ट में चोटियों और गर्तों का पता लगाता है और फिर डाउन ट्रेंड लाइन के लिए हाल की चोटियों और अपट्रेंड लाइन के लिए हाल के गर्तों से जुड़ने वाली ट्रेंड लाइनों की साजिश करता है। ट्रेंडलाइन को आमतौर पर मजबूत समर्थन प्रतिरोध स्तर माना जाता है। डाउन ट्रेंड लाइन टूट जाने पर ट्रेडर्स पोजीशन खरीद सकते हैं और ट्रेंड लाइन के ऊपर कीमत बनी रहती है। अपट्रेंड लाइन टूट जाने पर बिक्री की स्थिति को खोला जा सकता है, और मूल्य ट्रेंड लाइन से नीचे रहता है।
ऑटो ट्रेंड लाइन्स VTL का उपयोग त्रिकोणमिति और फ्लैग जैसे ज्यामितीय चार्ट पैटर्न की पहचान करने के लिए किया जा सकता है। सममित त्रिकोण, आरोही त्रिकोण और अवरोही त्रिकोण आसानी से पहचाने जा सकते हैं। इस सूचक की मदद से ऊपर और नीचे के झंडे की पहचान की जा सकती है। इसका उपयोग कई अन्य चार्ट पैटर्न जैसे ट्रेंड चैनल, पेनेंट आदि की पहचान करने के लिए किया जा सकता है।
पैरामीटर:
1. अवधि – यह पैरामीटर प्रवृत्ति लाइनों की साजिश रचने के लिए चोटियों और गर्तों की ताकत निर्धारित करता है। डिफ़ॉल्ट मान है 10. इस पैरामीटर मान को उचित ट्रेंड लाइन्स प्राप्त करने के लिए बदलें, मान बढ़ने से लंबी अवधि की ट्रेंड लाइन्स आएँगी और पैरामीटर कम होने से शॉर्ट टर्म ट्रेंड लाइन्स बनेगी।
2. सीमा – यह प्रवृत्ति लाइनों के लिए वापस देखने के लिए सलाखों की संख्या निर्धारित करता है।
प्रयोग:
विस्टोर से अटैचमेंट डाउनलोड करें या सीधे अपने टर्मिनल में विस्टोर टैब से इसे राइट क्लिक करके डाउनलोड करें और इंस्टॉल करें चुनें। इसे अपनी कंपनी VertexFX स्थानीय वीटीएल फ़ाइलें फ़ोल्डर में कॉपी करें, अर्थात C:Users”Username”AppDataRoamingVertexFX Client Terminals”Company name”VTL10Local VTL Scripts अपने क्लाइंट टर्मिनल को पुनः आरंभ करें या स्क्रिप्ट खोजने के लिए “स्थानीय वीटीएल लिपियों” ट्री नोड पर राइट क्लिक करें।
Additional information
| Plugin-Type | Client VTL – Custom Indicator |
|---|---|
| Compatibility |

