$0.00
In stock
The Aroon indicators is a client side VTL Script , that measure the number of periods since price recorded x-day high or low.
(Downloads - 1742)

The Aroon indicators is a client side VTL Script , that measure the number of periods since price recorded x-day high or low.
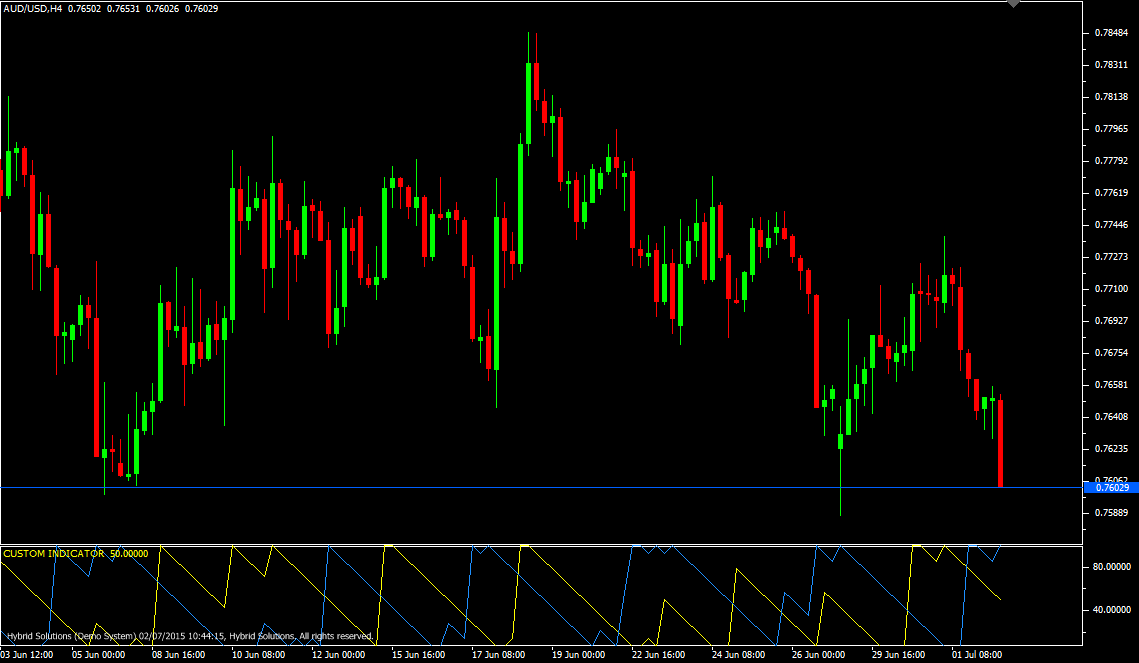
There are two separate indicators: Aroon-Up and Aroon-Down. Chartists use the Aroon indicators to spot emerging trends, identify consolidations define correction periods and anticipate reversals The Aroon indicators are shown in percentage terms and fluctuate between and 100. Aroon-Up is based on price highs, while Aroon-Down is based price lows. These two indicators are plotted side-by-side for comparison.
AROON Indicator is great for reading trends, watch as the “Up Line” (Default color:Yellow) reaches 100 means a strong up trend, and watch for the “Down Line” (Default color:Dodger Blue) reaches 100 means a strong down trend. AROON Indicator watchs also as they crosses each other. It’s great for signaling.Recomendation: interval: more than 30 minutes; period : 20
Usage
- Download the attachment.
- Copy it to your company VertexFX Local VTL Files folder i.e. C:Program FilesCompany Namevtl10Local VTL Scripts
- Restart your Client Terminal or Right Click on “Local VTL Scripts” Tree Node to find the script.
Additional information
| Plugin-Type | Client VTL – Custom Indicator |
|---|---|
| Compatibility |

