$0.00
In stock
3D Oscillator is a powerful VertexFX client side VTL indicator that gives excellent entry and exit signals for market cycles and turning points. It is derived from Relative Strength Index (RSI), Commodity Channel Index (CCI) and the Stochastic indicator. Since it is based on oscillators which identify market turning points, the combination of these oscillators, and smoothing them to eliminate lag enhances the quality of the signals.
(Downloads - 1771)

3D Oscillator is a powerful VertexFX client side VTL indicator that gives excellent entry and exit signals for market cycles and turning points. It is derived from Relative Strength Index (RSI), Commodity Channel Index (CCI) and the Stochastic indicator. Since it is based on oscillators which identify market turning points, the combination of these oscillators, and smoothing them to eliminate lag enhances the quality of the signals.
The concept behind the indicator is that CCI and RSI provide us information of market saturation and turning points. As the price saturates and moves sideways, starts to change its direction. At first step we calculate the RSI based on the D1_RSI_PERIOD. In the second step we calculate the CCI based on D3_TUNNEL_PERIOD.
In the third step we calculate the Stochastic of the RSI based upon the D2_STOCH_PERIOD. The Stochastic RSI is the difference between the current RSI and the minimum value of RSI over recent D2_STOCH_PERIOD, divided by the difference between the maximum and minimum values of RSI over the same period.
We then calculate the intermediate smoothed sum of the CCI and the Stochastic RSI, which is equal to :
HOT x CCI + (1 – HOT) x Stochastic RSI. Finally, the 3D Oscillator BLUE (MAIN) line is calculated by smoothing this intermediate smoothed sum with the previous value of the BLUE line using the SIGNAL_SMOOTH.
The RED (SIGNAL) line is calculated from the BLUE line by smoothing it again using the SIGNAL_SMOOTH.
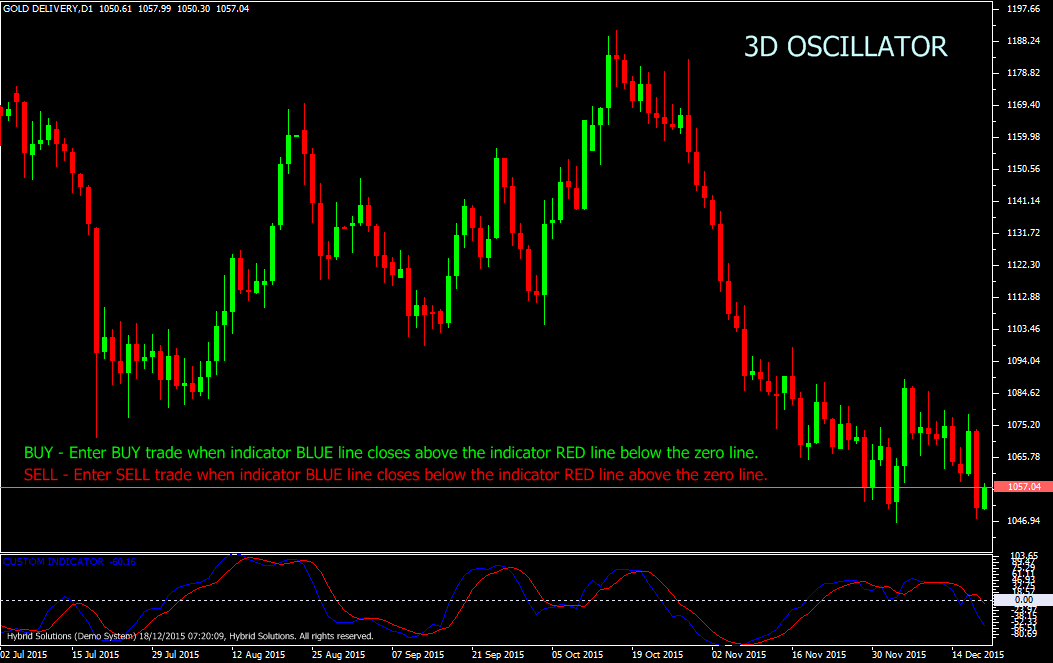
Buy: Place Buy trade when indicator Blue line closes above the indicator Red line below the zero line.
Sell: Place Sell trade when indicator Blue line closes below the indicator Red line above the zero line.
Usage
- Download the attachment from vStore or directly from the vStore tab in your terminal by performing a right click on it and selecting Download & Install
- Copy it to your company VertexFX Local VTL Files folder i.e. C:ProgramDataVertexFX Client Terminals”Company name”VTL10Local VTL Scripts
- Restart your Client Terminal or Right Click on “Local VTL Scripts” Tree Node to find the script.
Additional information
| Plugin-Type | Client VTL – Custom Indicator |
|---|---|
| Compatibility |

