$0.00
In stock
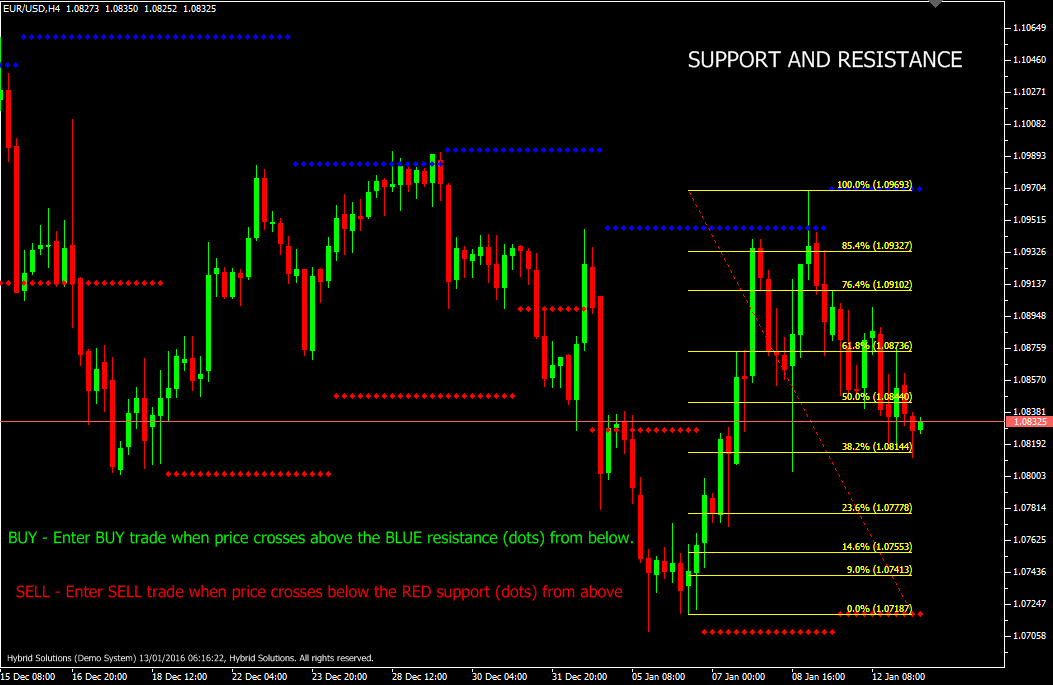
Support and Resistance is a VertexFX client side VTL indicator that provides crucial support and resistance levels, as well as the Fibonacci levels between those support and resistance levels. It can be used for both sideways (reversal) trading, or for breakout trading. This indicator should be used in confirmation with other indicators. It is recommended to use this indicator on H1, H4 and Daily charts. This indicator may not be suitable on charts of lower time-frames. The indicator is calculated based upon the Highs and Low values. In the first step we calculate the 10 period Simple Moving Average (SMA) of the Close price. The support and resistance values are calculated based upon the price closing above or below the SMA. The Support and Resistance are calculated Lowest Low and the Highest High over the recent 20 bars respectively.
(Downloads - 1507)

Support and Resistance is a VertexFX client side VTL indicator that provides crucial support and resistance levels, as well as the Fibonacci levels between those support and resistance levels. It can be used for both sideways (reversal) trading, or for breakout trading. This indicator should be used in confirmation with other indicators. It is recommended to use this indicator on H1, H4 and Daily charts. This indicator may not be suitable on charts of lower time-frames. The indicator is calculated based upon the Highs and Low values. In the first step we calculate the 10 period Simple Moving Average (SMA) of the Close price. The support and resistance values are calculated based upon the price closing above or below the SMA. The Support and Resistance are calculated Lowest Low and the Highest High over the recent 20 bars respectively.
Breakout Trading:
This strategy should be employed when there is a strong possibility of a breakout in price in Bullish or Bearish direction.
Buy: Place Buy trade when price crosses above the Blue resistance (dots) from below. Place stop-loss below the nearest Swing Low, or at 76.4% retracement level.
Sell: Place Sell trade when price crosses below the Red support (dots) from above. Place stop-loss above the nearest Swing High, or at 23.6% retracement level.
Reversal Trading:
This strategy should be employed when there is a strong possibility of the price reversing within the Blue and Red bands.
Buy: Place Buy trade when the price crosses (or bounces) above the 23.6% retracement level. Place stop-loss below the Red support.
Sell: Place Sell trade when the price crosses (or bounces) below the 76.4% retracement level. Place stop-loss above the BLUE support.
Additional information
| Plugin-Type | Client VTL – Custom Indicator |
|---|---|
| Compatibility |

