$0.00
In stock
VolatilityRatio is a powerful VertexFX client-side indicator based Volatility and trend reversal.
(Downloads - 1108)

Volatility Ratio is a powerful VertexFX client-side indicator based on volatility and trend reversal.
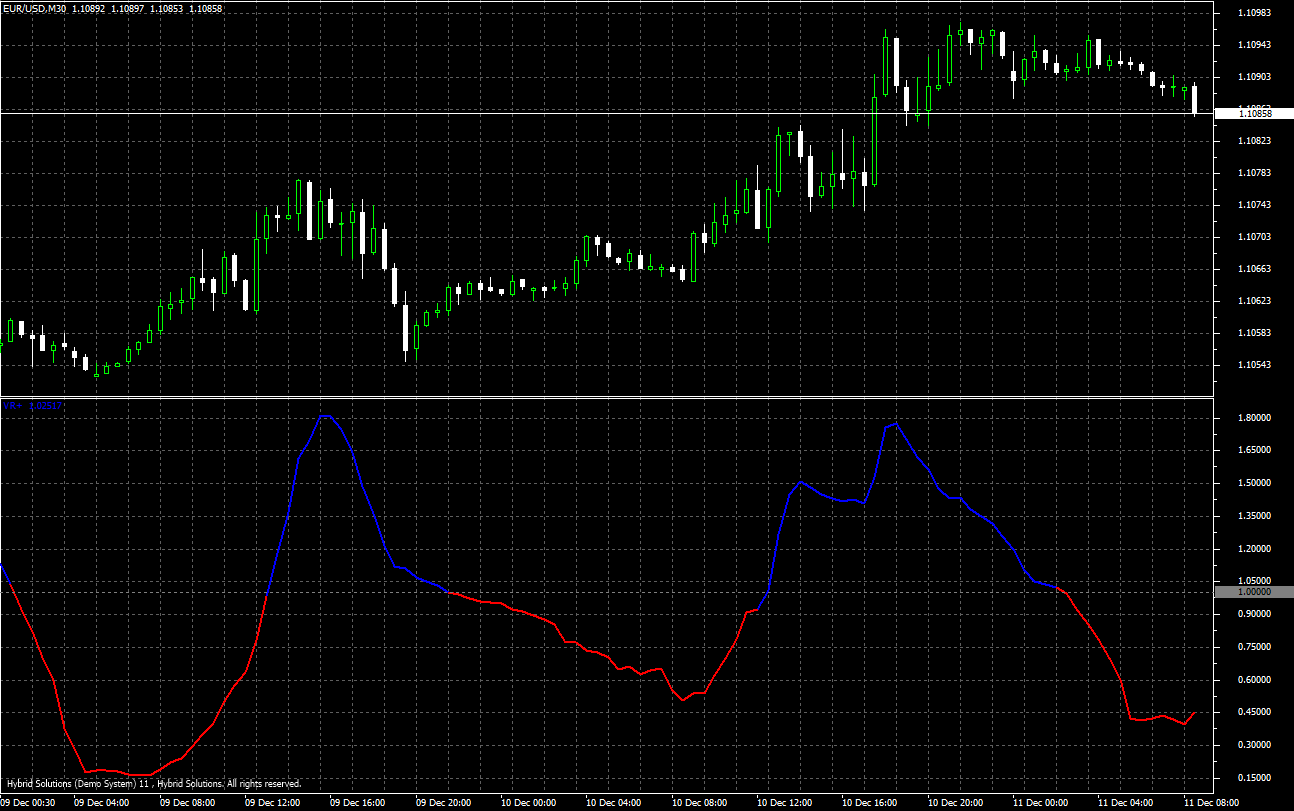
Volatility is a measure of fast market movements. When volatility increases the markets are moving fast and making big ranges. However, we cannot predict the direction of the market based on the volatility. The VolatilityRatio (VR) determines the direction and the end of the trend thus providing a valuable tool to traders.
When VR is above 1 it indicates a bullish trend, and similarly, when VR is below 1 it indicates a bearish trend. By waiting for the bullish and bearish trends to top out and bottom out respectively traders can exit at the earliest their LONG and SHORT positions respectively.
BUY / EXIT SHORT – Enter LONG (or exit SHORT) when the Volatility Ratio is RED and bottoms out. The stop-loss can be placed below the nearest Swing Low. Use short term EMA to ensure that the current price is above the EMA.
SHORT / EXIT LONG – Enter SHORT (or exit LONG) when the Volatility Ratio is BLUE and tops out. The stop-loss can be placed above the nearest Swing High. Use short term EMA to ensure that the current price is below the EMA.
Usage
- Download the attachment from vStore or directly from the vStore tab in your terminal by performing a right-click on it and selecting Download & Install
- Copy it to your company VertexFX Local VTL Files folder i.e.C:Users”Username”AppDataRoamingVertexFX Client Terminals“Company name”VTL11Local VTL Scripts
- Restart your Client Terminal or Right Click on “Local VTL Scripts” Tree Node to find the script.
VolatilityRatio एक शक्तिशाली वर्टेक्सएफएक्स क्लाइंट-साइड इंडिकेटर आधारित अस्थिरता और ट्रेंड रिवर्सल है।
अस्थिरता तेज बाजार आंदोलनों का एक उपाय है। जब अस्थिरता बढ़ती है तो बाजार तेजी से आगे बढ़ रहे हैं और बड़ी रेंज बना रहे हैं। हालाँकि, हम बाजार की अस्थिरता के आधार पर दिशा का अनुमान नहीं लगा सकते हैं। VolatilityRatio (VR) दिशा और प्रवृत्ति के अंत को निर्धारित करता है और इस प्रकार व्यापारियों को एक मूल्यवान उपकरण प्रदान करता है।
जब वीआर 1 से ऊपर होता है तो यह एक तेजी की प्रवृत्ति को इंगित करता है, और इसी तरह जब वीआर 1 से नीचे होता है तो यह मंदी की प्रवृत्ति को दर्शाता है। तेजी और मंदी के रुझानों के लिए प्रतीक्षा करने से क्रमशः व्यापारी ऊपर और नीचे से बाहर निकलते हैं और क्रमशः अपने LONG और SHORT पदों से बाहर निकल सकते हैं।
खरीदें / बाहर निकलें – जब अस्थिरता अनुपात लाल होता है और बाहर निकलता है, तो लंबी (या बाहर निकलें) दर्ज करें। स्टॉप-लॉस को निकटतम स्विंग लो के नीचे रखा जा सकता है। यह सुनिश्चित करने के लिए कि वर्तमान मूल्य ईएमए से ऊपर है, अल्पावधि ईएमए का उपयोग करें।
SHORT / EXIT LONG – जब अस्थिरता अनुपात BLUE होता है और सबसे ऊपर होता है, तो SHORT (या बाहर निकलें) दर्ज करें। स्टॉप-लॉस को निकटतम स्विंग उच्च के ऊपर रखा जा सकता है। यह सुनिश्चित करने के लिए कि वर्तमान मूल्य ईएमए से नीचे है, अल्पावधि ईएमए का उपयोग करें।
प्रयोग:
विस्टोर से अटैचमेंट डाउनलोड करें या सीधे अपने टर्मिनल में विस्टोर टैब से इसे राइट क्लिक करके डाउनलोड करें और इंस्टॉल करें चुनें।
इसे अपनी कंपनी VertexFX स्थानीय वीटीएल फ़ाइलें फ़ोल्डर में कॉपी करें, अर्थात C:Users”Username”AppDataRoamingVertexFX Client Terminals”Company name”VTL11Local VTL Scripts
अपने क्लाइंट टर्मिनल को पुनः आरंभ करें या स्क्रिप्ट खोजने के लिए “स्थानीय वीटीएल लिपियों” ट्री नोड पर राइट क्लिक करें।
Additional information
| Plugin-Type | Client VTL – Custom Indicator |
|---|---|
| Compatibility |

