$0.00
In stock
Kase Peak Oscillator is a VertexFX VTL indicator that is made of statistical observation of prices over the last KPeriod
(Downloads - 1092)

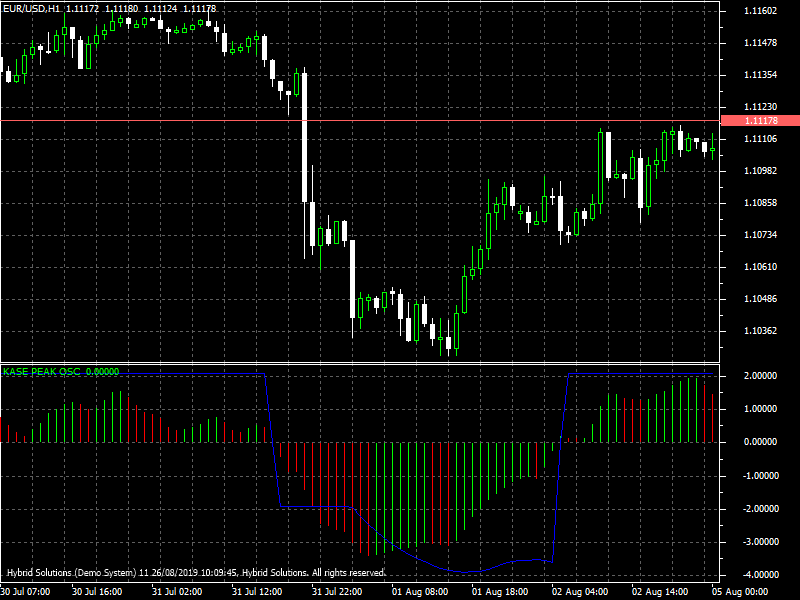
Kase Peak Oscillator is a VertexFX VTL indicator that is made of statistical observation of prices over the last KPeriod. It automatically adapts its cycle to any timeframe or instrument by using a percentile rank of what happens now in comparison to the whole distribution of past values. It consists of a histogram and a line indicating overbought oversold levels.
Buy Signal: Histogram cross above the zero level
Sell Signal: Histogram cross below the zero levels
When the histogram reaches the line, chances are a reversal or consolidation may follow. However, in strong trends, the histogram may overshoot the line for may bars before slowing down. This can be used to book profits and open trades if a reversal is confirmed by other indicators or price action. Like all indicators, Kase Peak Oscillator also generate whipsaws in consolidating markets.
The divergence between the histogram and price bars present good trading opportunities. When price makes new lows and the oscillator fails to make new lows, it is a divergence between the price and the oscillator. When divergence happens, there is a high probability that the trend reverse upward. For trend reversal down, the price makes new high and oscillator fail to reach a new high.
Parameters:
1. K Period – Oscillator calculation period
2. CalcBars – Number of bars the indicator is calculated on
Usage
- Download the attachment from vStore or directly from the vStore tab in your terminal by performing a right-click on it and selecting Download & Install
- Copy it to your company VertexFX Local VTL Files folder i.e.C:Users”Username”AppDataRoamingVertexFX Client Terminals“Company name”VTL11Local VTL Scripts
- Restart your Client Terminal or Right Click on “Local VTL Scripts” Tree Node to find the script.
Hindi Version
कैस पीक “ऑसिलेटर पिछले केपीरियोड पर कीमतों के सांख्यिकीय अवलोकन से बना है। यह पिछले मानों के पूरे वितरण की तुलना में अब जो कुछ भी होता है उसका एक प्रतिशतक रैंक का उपयोग करके अपने चक्र को किसी भी समय सीमा या साधन के लिए स्वचालित रूप से लागू करता है। इसमें शामिल हैं। हिस्टोग्राम और एक रेखा जो ओवरबॉट के ओवरऑल स्तरों को दर्शाती है।
सिग्नल खरीदें: हिस्टोग्राम शून्य स्तर से ऊपर
सिग्नल बेचें: शून्य स्तर के नीचे हिस्टोग्राम क्रॉस
जब हिस्टोग्राम लाइन तक पहुंच जाता है, तो संभावना एक उलट होती है या समेकन का पालन हो सकता है। हालांकि, मजबूत रुझानों में, हिस्टोग्राम धीमा होने से पहले बार के लिए लाइन का निरीक्षण कर सकता है। इसका उपयोग मुनाफे को बुक करने और ट्रेडों को खोलने के लिए किया जा सकता है यदि अन्य संकेतकों या मूल्य कार्रवाई द्वारा उलट की पुष्टि की जाती है। सभी संकेतकों की तरह, कैस पीक ” ऑसिलेटर भी बाजारों को समेकित करने में व्हिपसॉव उत्पन्न करता है।
हिस्टोग्राम और मूल्य सलाखों के बीच विचलन व्यापार के अच्छे अवसरों को प्रस्तुत करता है। जब कीमत नए चढ़ाव बनाती है और थरथरानवाला नए चढ़ाव बनाने में विफल रहता है, तो यह कीमत और थरथरानवाला के बीच एक विचलन है। जब विचलन होता है, तो उच्च संभावना है कि प्रवृत्ति ऊपर की तरफ उलट जाती है। ट्रेंड रिवर्सल के लिए, कीमत नए उच्च बनाता है और दोलक एक नए उच्च तक पहुंचने में विफल रहता है।
पैरामीटर:
1. K Period – थरथरानवाला गणना अवधि
2. CalcBars – संकेतक की गणना सलाखों की संख्या पर की जाती है
प्रयोग:
विस्टोर से अटैचमेंट डाउनलोड करें या सीधे अपने टर्मिनल में विस्टोर टैब से इसे राइट क्लिक करके डाउनलोड करें और इंस्टॉल करें चुनें।
इसे अपनी कंपनी VertexFX स्थानीय वीटीएल फ़ाइलें फ़ोल्डर में कॉपी करें, अर्थात C:Users”Username”AppDataRoamingVertexFX Client Terminals”Company name”VTL10Local VTL Scripts
अपने क्लाइंट टर्मिनल को पुनः आरंभ करें या स्क्रिप्ट खोजने के लिए “स्थानीय वीटीएल लिपियों” ट्री नोड पर राइट क्लिक करें।
Additional information
| Plugin-Type | Client VTL – Custom Indicator |
|---|---|
| Compatibility |


Reviews
There are no reviews yet.