$0.00
In stock
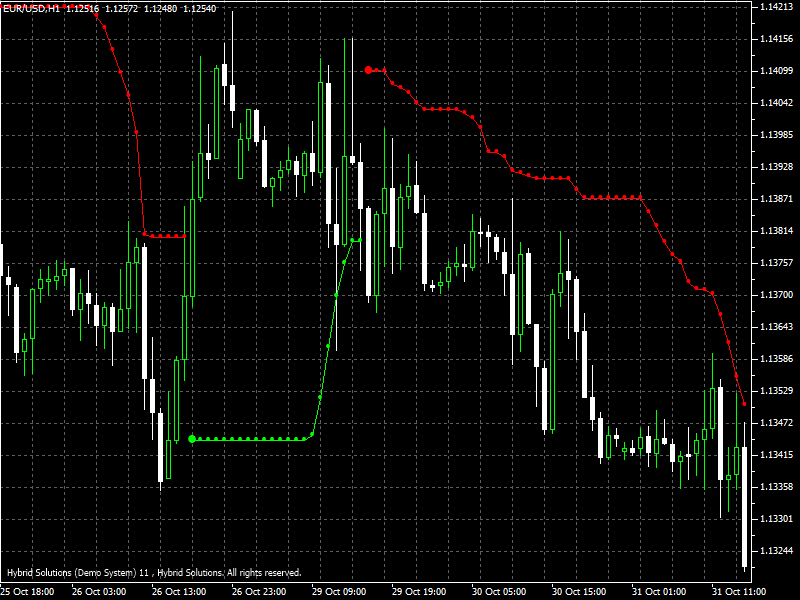
Bollinger Bands stops is a VertexFX trend following indicator. The green line indicates uptrend and the red line indicates a downtrend. When price closes above the red line, uptrend begins. Buy Positions can be opened immediately or on a pullback to a support level in the new uptrend. The green line can be used as a stop loss.
(Downloads - 1171)

Bollinger Bands stops is a VertexFX trend following indicator. The green line indicates uptrend and the red line indicates a downtrend. When price closes above the red line, uptrend begins. Buy Positions can be opened immediately or on a pullback to a support level in the new uptrend. The green line can be used as a stop loss.
Similarly, when the red line appears, sell positions can be opened immediately or on a pullback to resistance with the red line as stop loss.
This indicator works best in trending markets, in consolidating markets signals may be not effective.
The indicator is based on Bollinger bands. It uses the bands to pick trend direction and construct a trailing stop loss like indicator.
The parameters can be used to customize the indicator.
1. BB_Length: Bollinger Bands Calculation Period
2. BB_Deviation: Standard Deviations to use in Bollinger Bands
3. Singal: Signal Display mode; 1-Signals & Stops; 0-only Stops; 2-only Signals
4. Line: Line Display mode; 0-no,1-yes
Usage
- Download the attachment from vStore or directly from the vStore tab in your terminal by performing a right click on it and selecting Download & Install
- Copy it to your company VertexFX Local VTL Files folder i.e.C:Users”Username”AppDataRoamingVertexFX Client Terminals“Company name”VTL10Local VTL Scripts
- Restart your Client Terminal or Right Click on “Local VTL Scripts” Tree Node to find the script.
Hindi Version
बोलिंगर बैंड स्टॉप्स संकेतक के बाद एक प्रवृत्ति है। ग्रीन लाइन अपट्रेंड को इंगित करती है और रेड लाइन डाउन ट्रेंड को दर्शाती है। जब मूल्य लाल रेखा के ऊपर होता है, तो ऊपर की प्रवृत्ति शुरू होती है। खरीदें स्थिति तुरंत या नई अपट्रेंड में समर्थन स्तर पर वापस खींचने पर खोला जा सकता है।
हरी रेखा का उपयोग स्टॉप लॉस के रूप में किया जा सकता है। जब लाल रेखा प्रकट होती है, तो स्टॉप लॉस के रूप में लाल रेखा के साथ प्रतिरोध करने के लिए बेच स्थिति तुरंत या पुलबैक पर खोली जा सकती है।
यह संकेतक ट्रेंडिंग मार्केट में सबसे अच्छा काम करता है, बाजारों को मजबूत करने में सिग्नल प्रभावी नहीं हो सकते हैं।
1. BB_Length: बोलिंगर बैंड की गणना की अवधि
2. BB_Deviation: बोलिंगर बैंड में उपयोग करने के लिए मानक विचलन
3. सिंगल: सिग्नल डिस्प्ले मोड; 1-सिग्नल और स्टॉप; 0-केवल स्टॉप्स; 2-केवल संकेत
4. लाइन: लाइन डिस्प्ले मोड; 0-नहीं, 1-हाँ
प्रयोग विस्टोर से अटैचमेंट डाउनलोड करें या सीधे अपने टर्मिनल में विस्टोर टैब से इसे राइट क्लिक करके डाउनलोड करें और इंस्टॉल करें चुनें। इसे अपनी कंपनी VertexFX स्थानीय वीटीएल फ़ाइलें फ़ोल्डर में कॉपी करें, अर्थात C:Users”Username”AppDataRoamingVertexFX Client Terminals”Company name”VTL10Local VTL Scripts स्क्रिप्ट ढूंढने के लिए “स्थानीय वीटीएल स्क्रिप्ट” ट्री नोड पर अपने क्लाइंट टर्मिनल या राइट क्लिक को पुनरारंभ करें।
Additional information
| Plugin-Type | Client VTL – Custom Indicator |
|---|---|
| Compatibility |

