$0.00
In stock
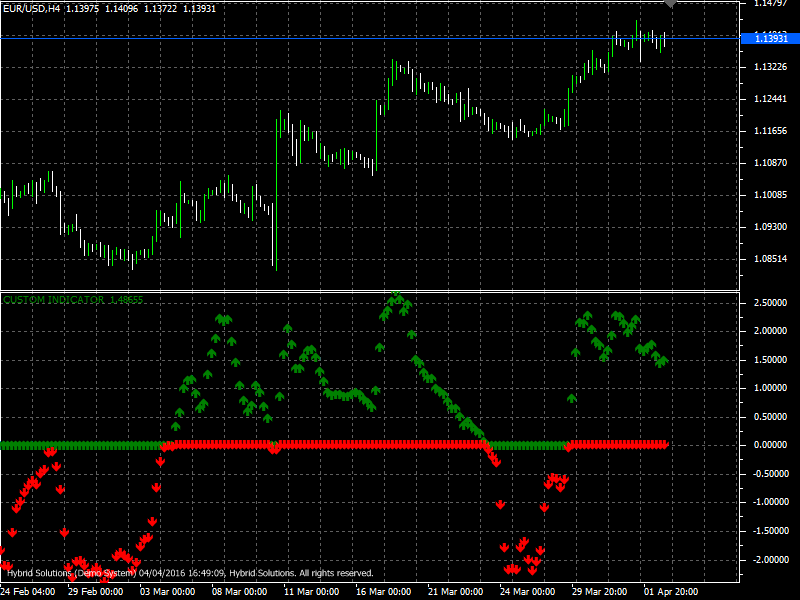
Kuskus starlight is a VertexFX client side VTL indicator that is designed to identify the market trend changes. Kuskus starlight consists of ‘arrow’ like figures of blue and red color. It fluctuates off the positive and negative territories.
(Downloads - 1730)

Kuskus starlight is a VertexFX client side VTL indicator that is designed to identify the market trend changes. Kuskus starlight consists of ‘arrow’ like figures of blue and red color. It fluctuates off the positive and negative territories.
Main idea of using this indicator is you should buy only when the momentum is positive and and sell when the momentum is negative.
At first step, we calculate the Highest High value over the RangePeriods bars. In the next step, we calculate the Lowest Low value over the RangePeriods bars.
After we count GreatestRange value as the difference between the Highest High and Lowest Low.We calculate the ratio by dividing the difference between the (MidPrice-Lowest Low) and the current GreatestRange. The difference is multiplied by the K factor (which is 2) and from this value, subtract 1. This value is used directly for the construction of the indicator line.
The concept behind Kuskus starlight indicator is that in trending markets, the Highs and Lows move in unison. In uptrends, the markets make higher highs and higher lows. The range also increases gradually. As the end of the trend approaches, the range narrows down as the market moves sideways. Kuskus starlight;indicator captures this behavior and presents it in the curve. When the indicator moves upwards, it signals an uptrend, and a downward move of the indicator signals a downtrend. The use of log-normal smoothes the indicator value, and also attempts to reduce the lag. Likewise, in sideways and undecided markets since Higher Highs / Higher Lows are not made, neither the Lower Lows / Lower Highs, the indicator saturates around the zero levels.
Buy – Place Buy position when indicator value has bottomed out below zero, and is rising for at least two bars.
Sell – Place Sell position when indicator value has topped out above zero, and is falling for at least two bars.
Usage
- Download the attachment from vStore or directly from the vStore tab in your terminal by performing a right click on it and selecting Download & Install
- Copy it to your company VertexFX Local VTL Files folder i.e. C:ProgramDataVertexFX Client Terminals”Company name”VTL10Local VTL Scripts
- Restart your Client Terminal or Right Click on “Local VTL Scripts” Tree Node to find the script.
Additional information
| Plugin-Type | Client VTL – Custom Indicator |
|---|---|
| Compatibility |

